Market Statistics

South Santa Barbara County Market Statistics

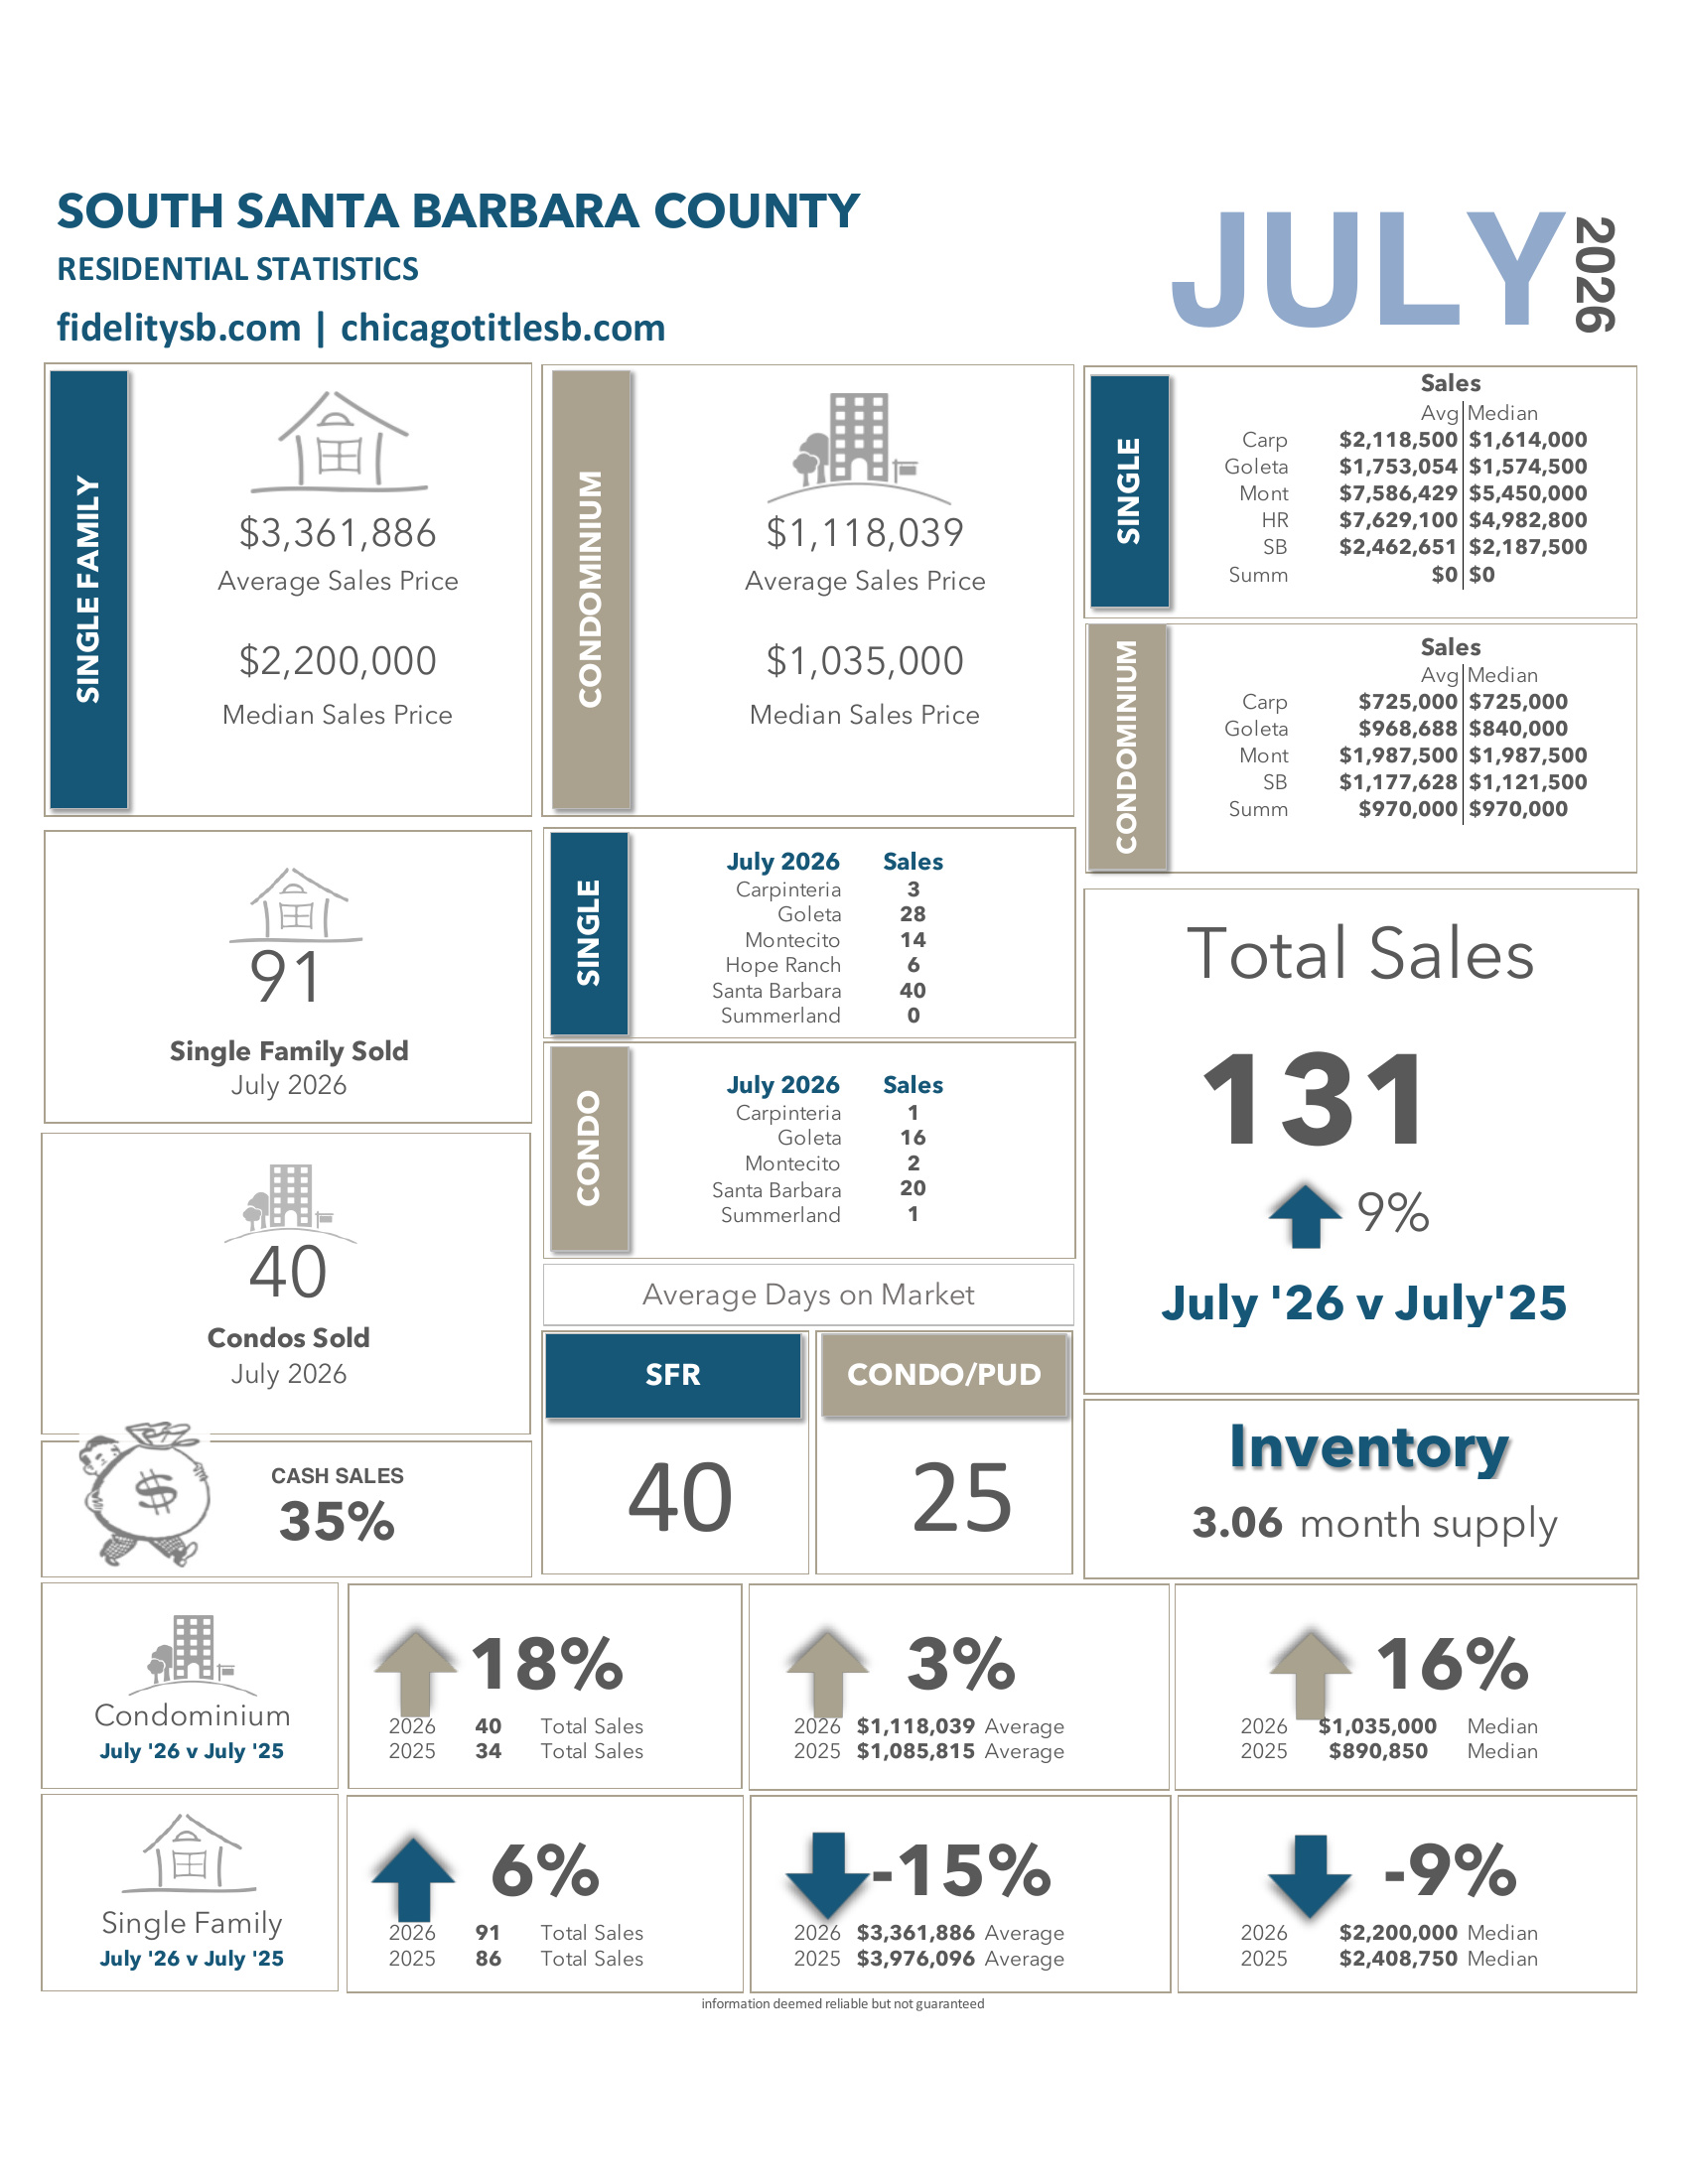
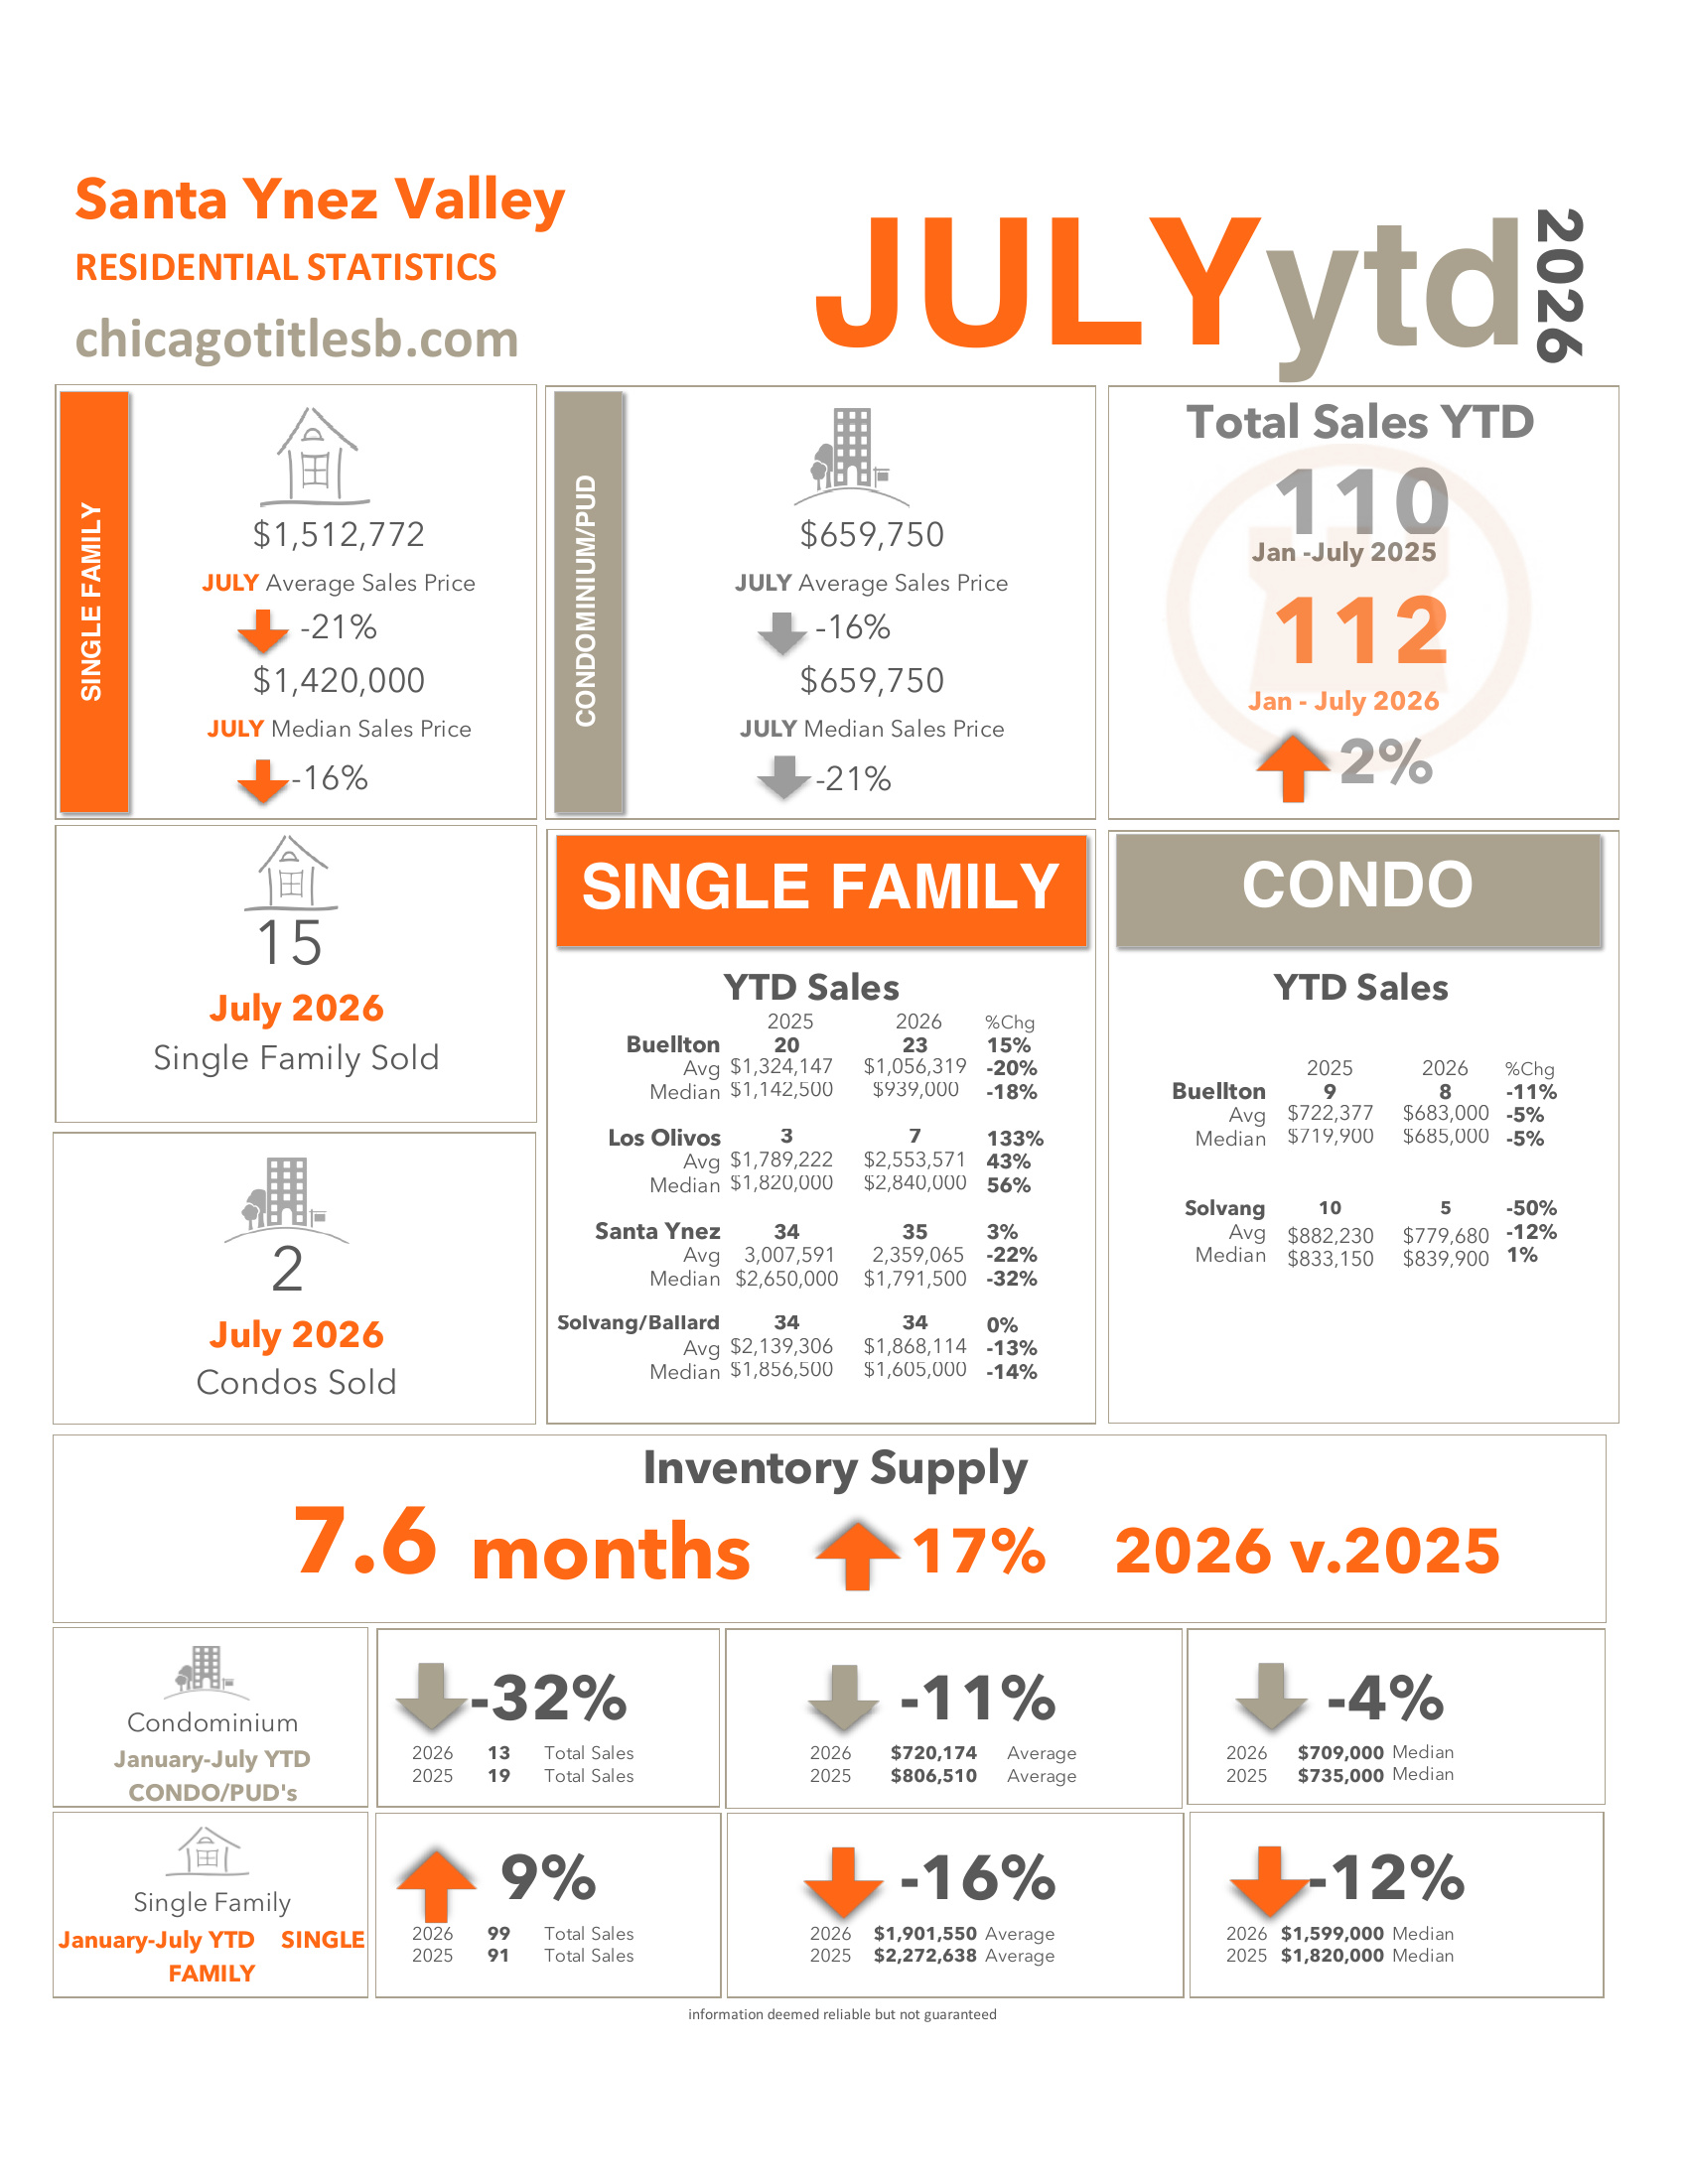
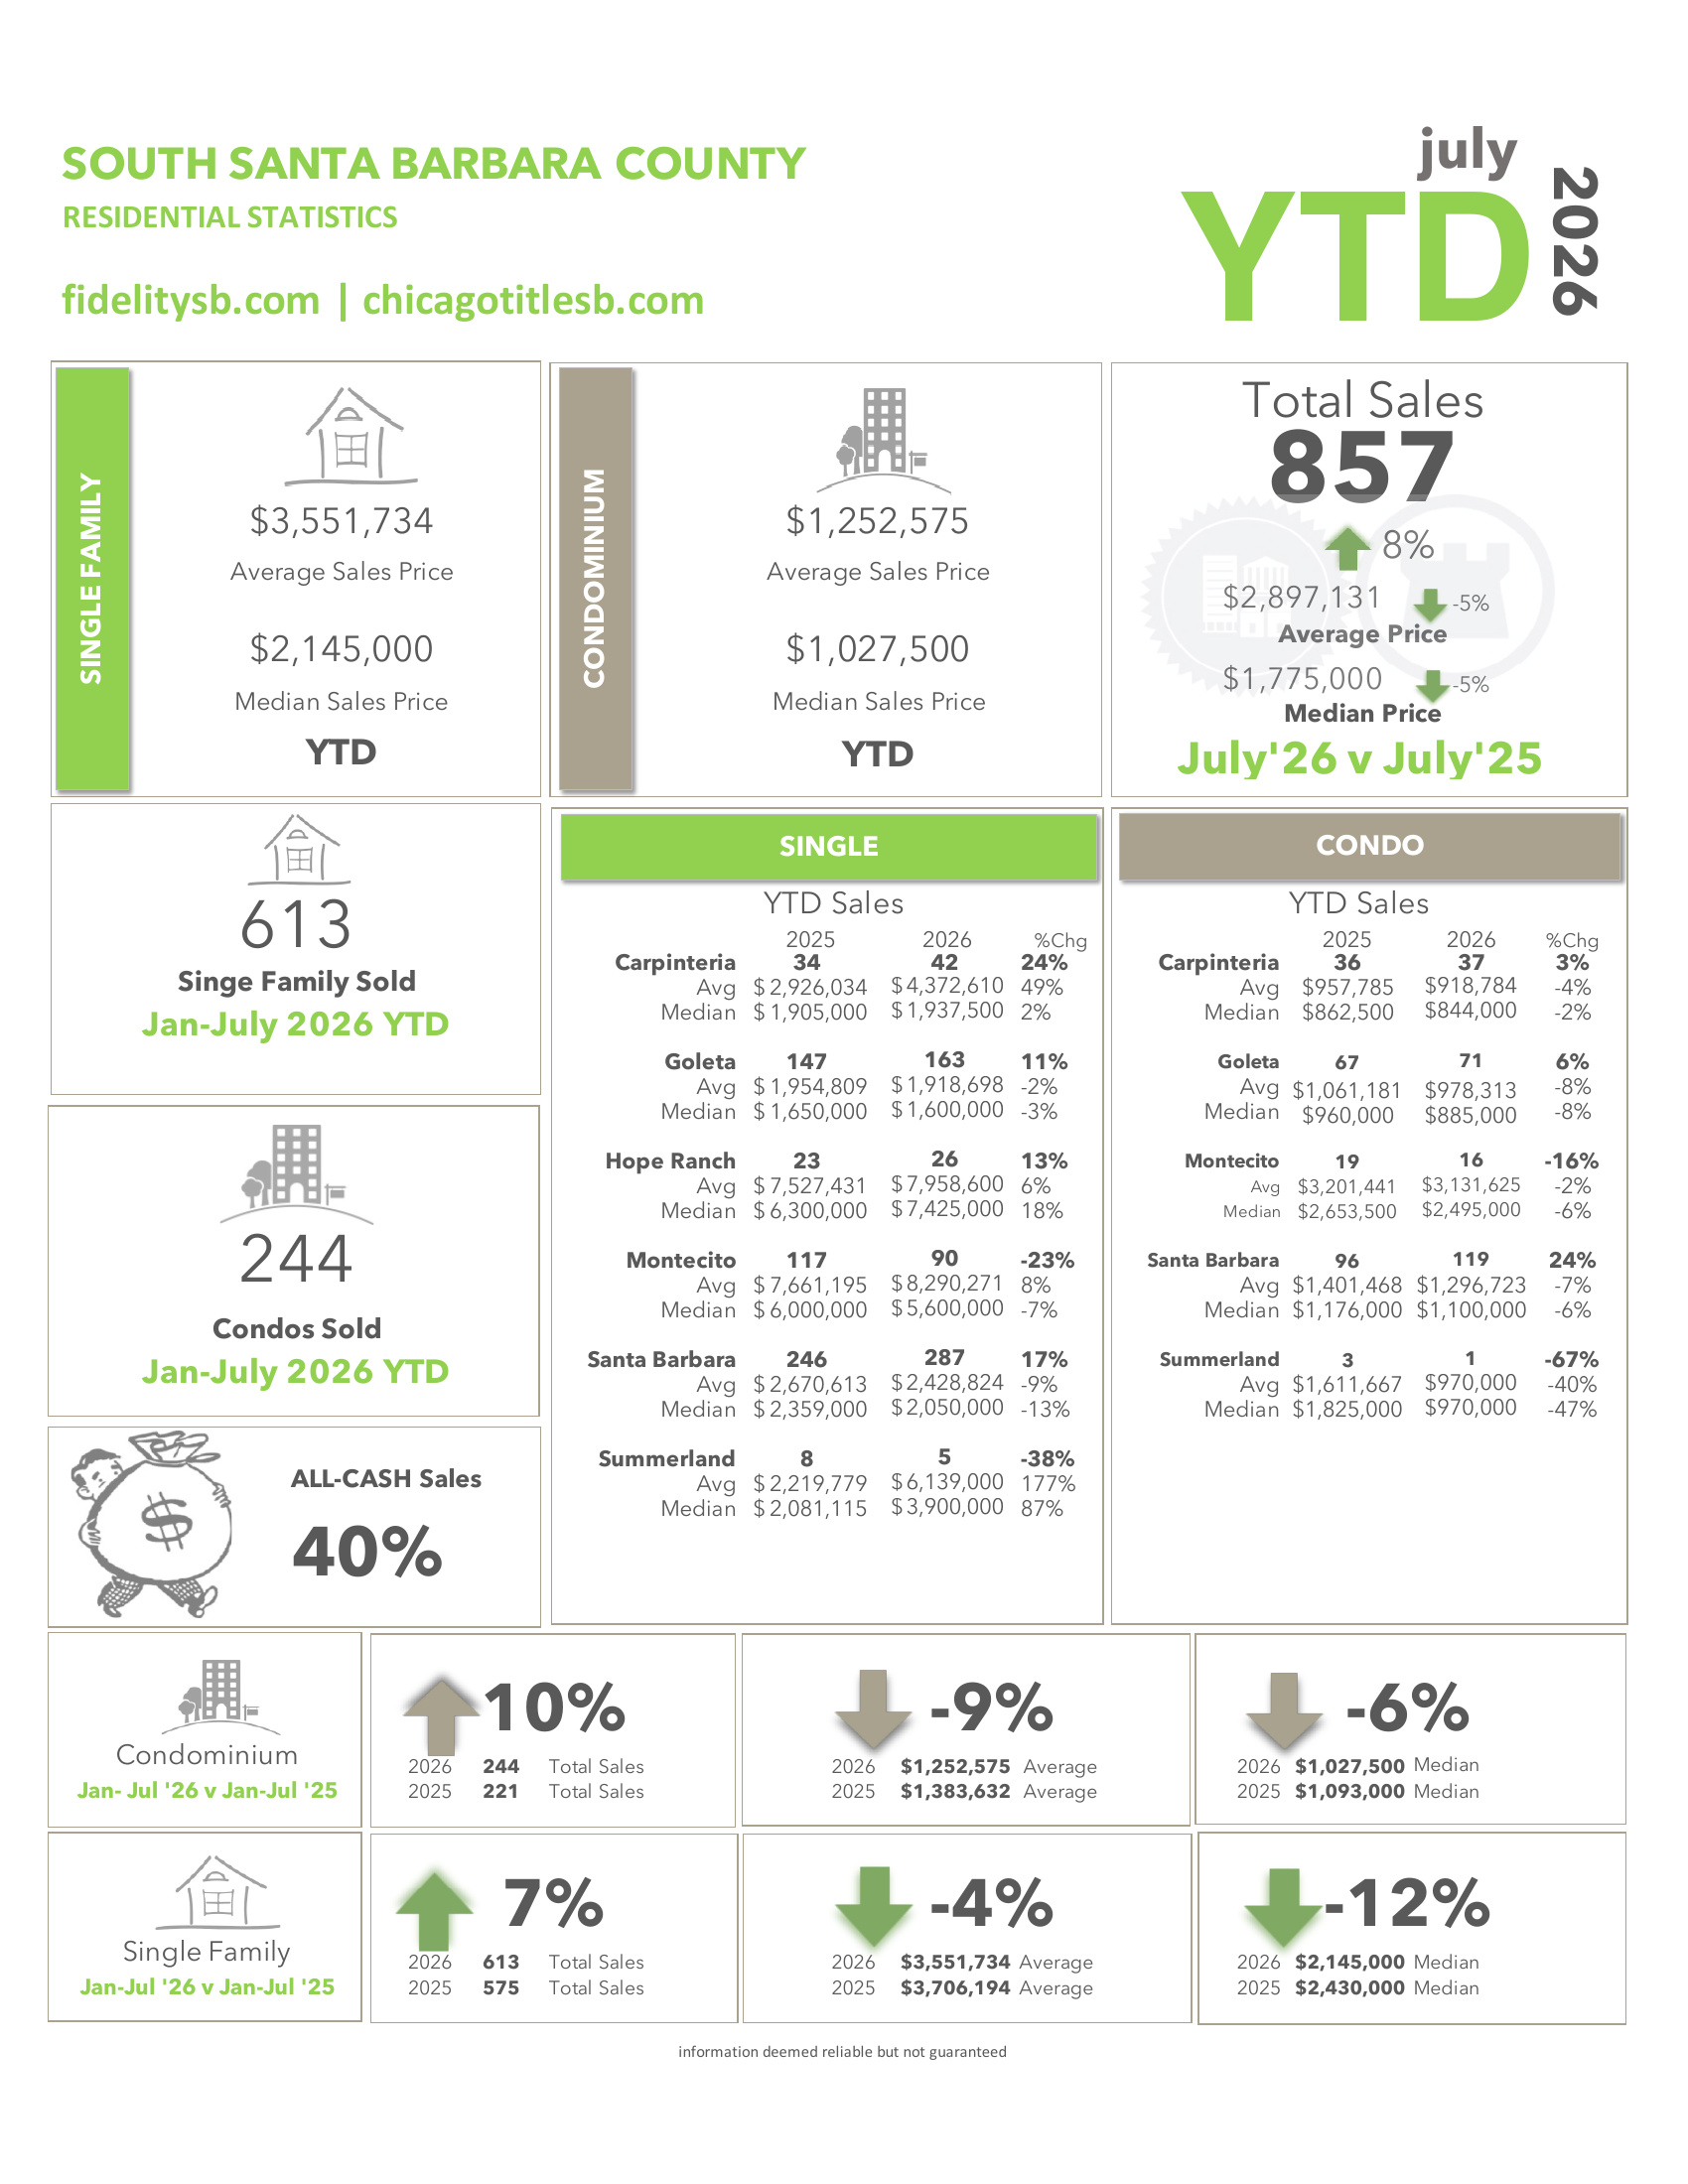
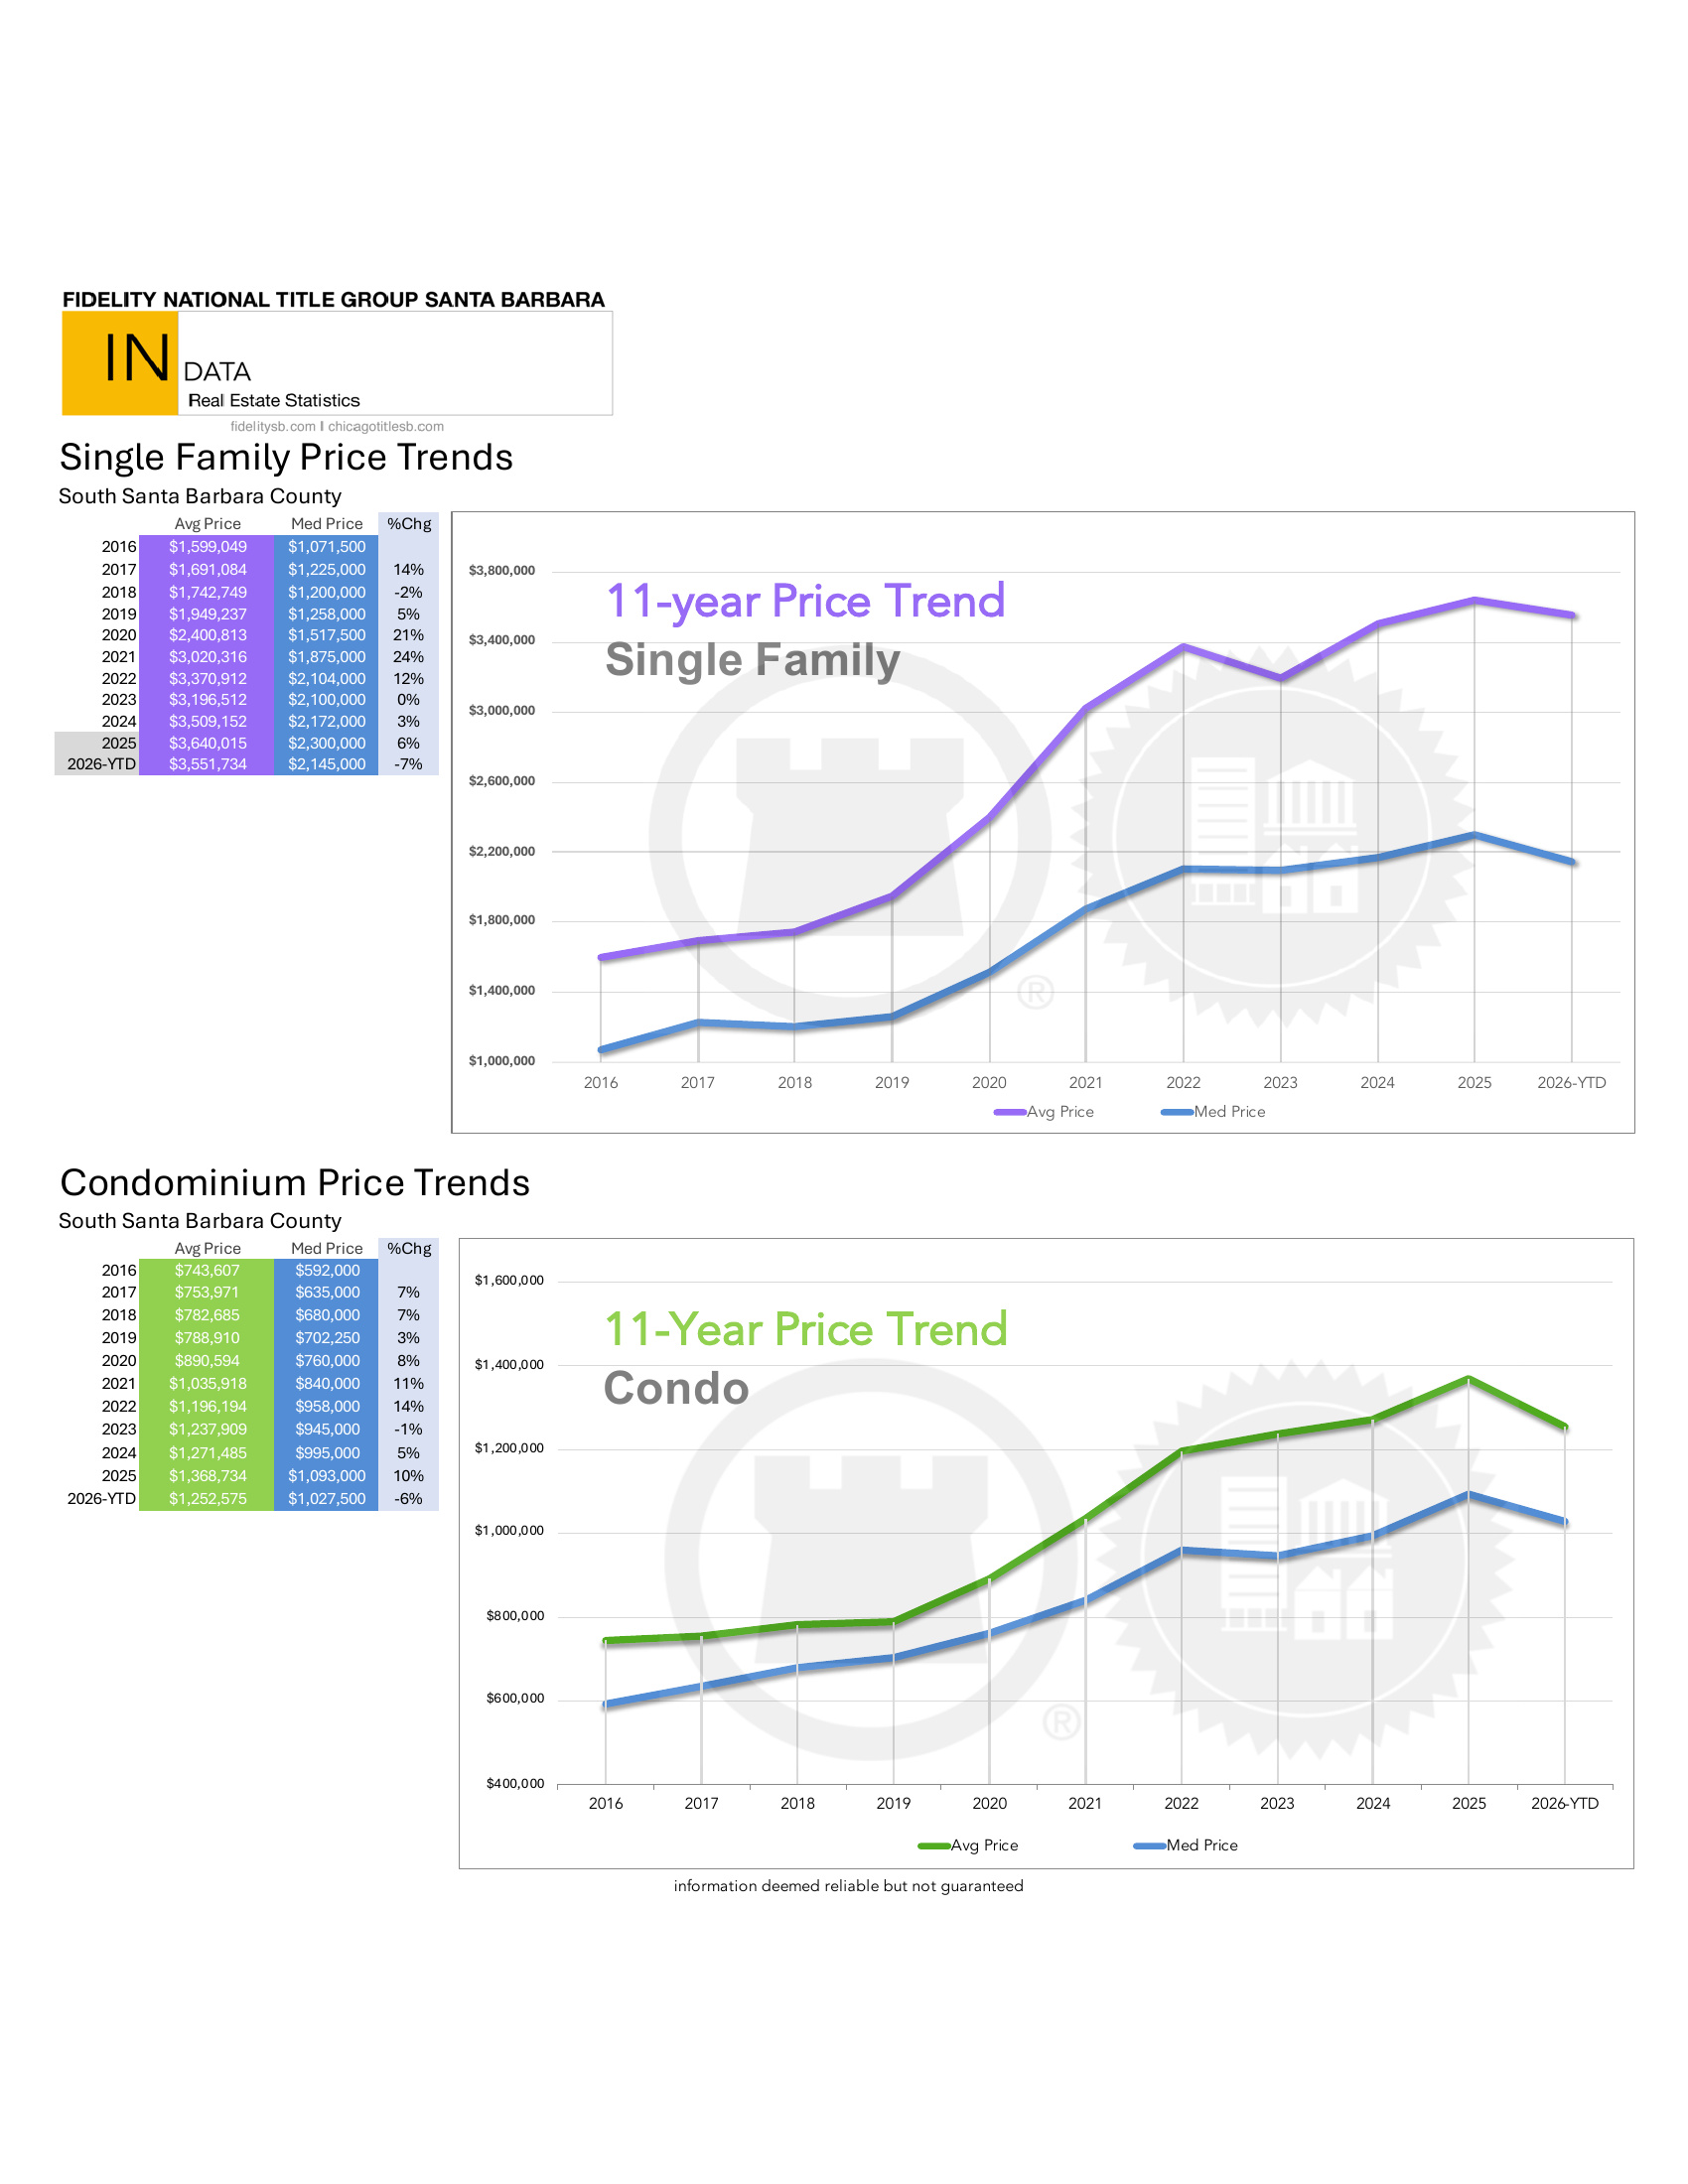
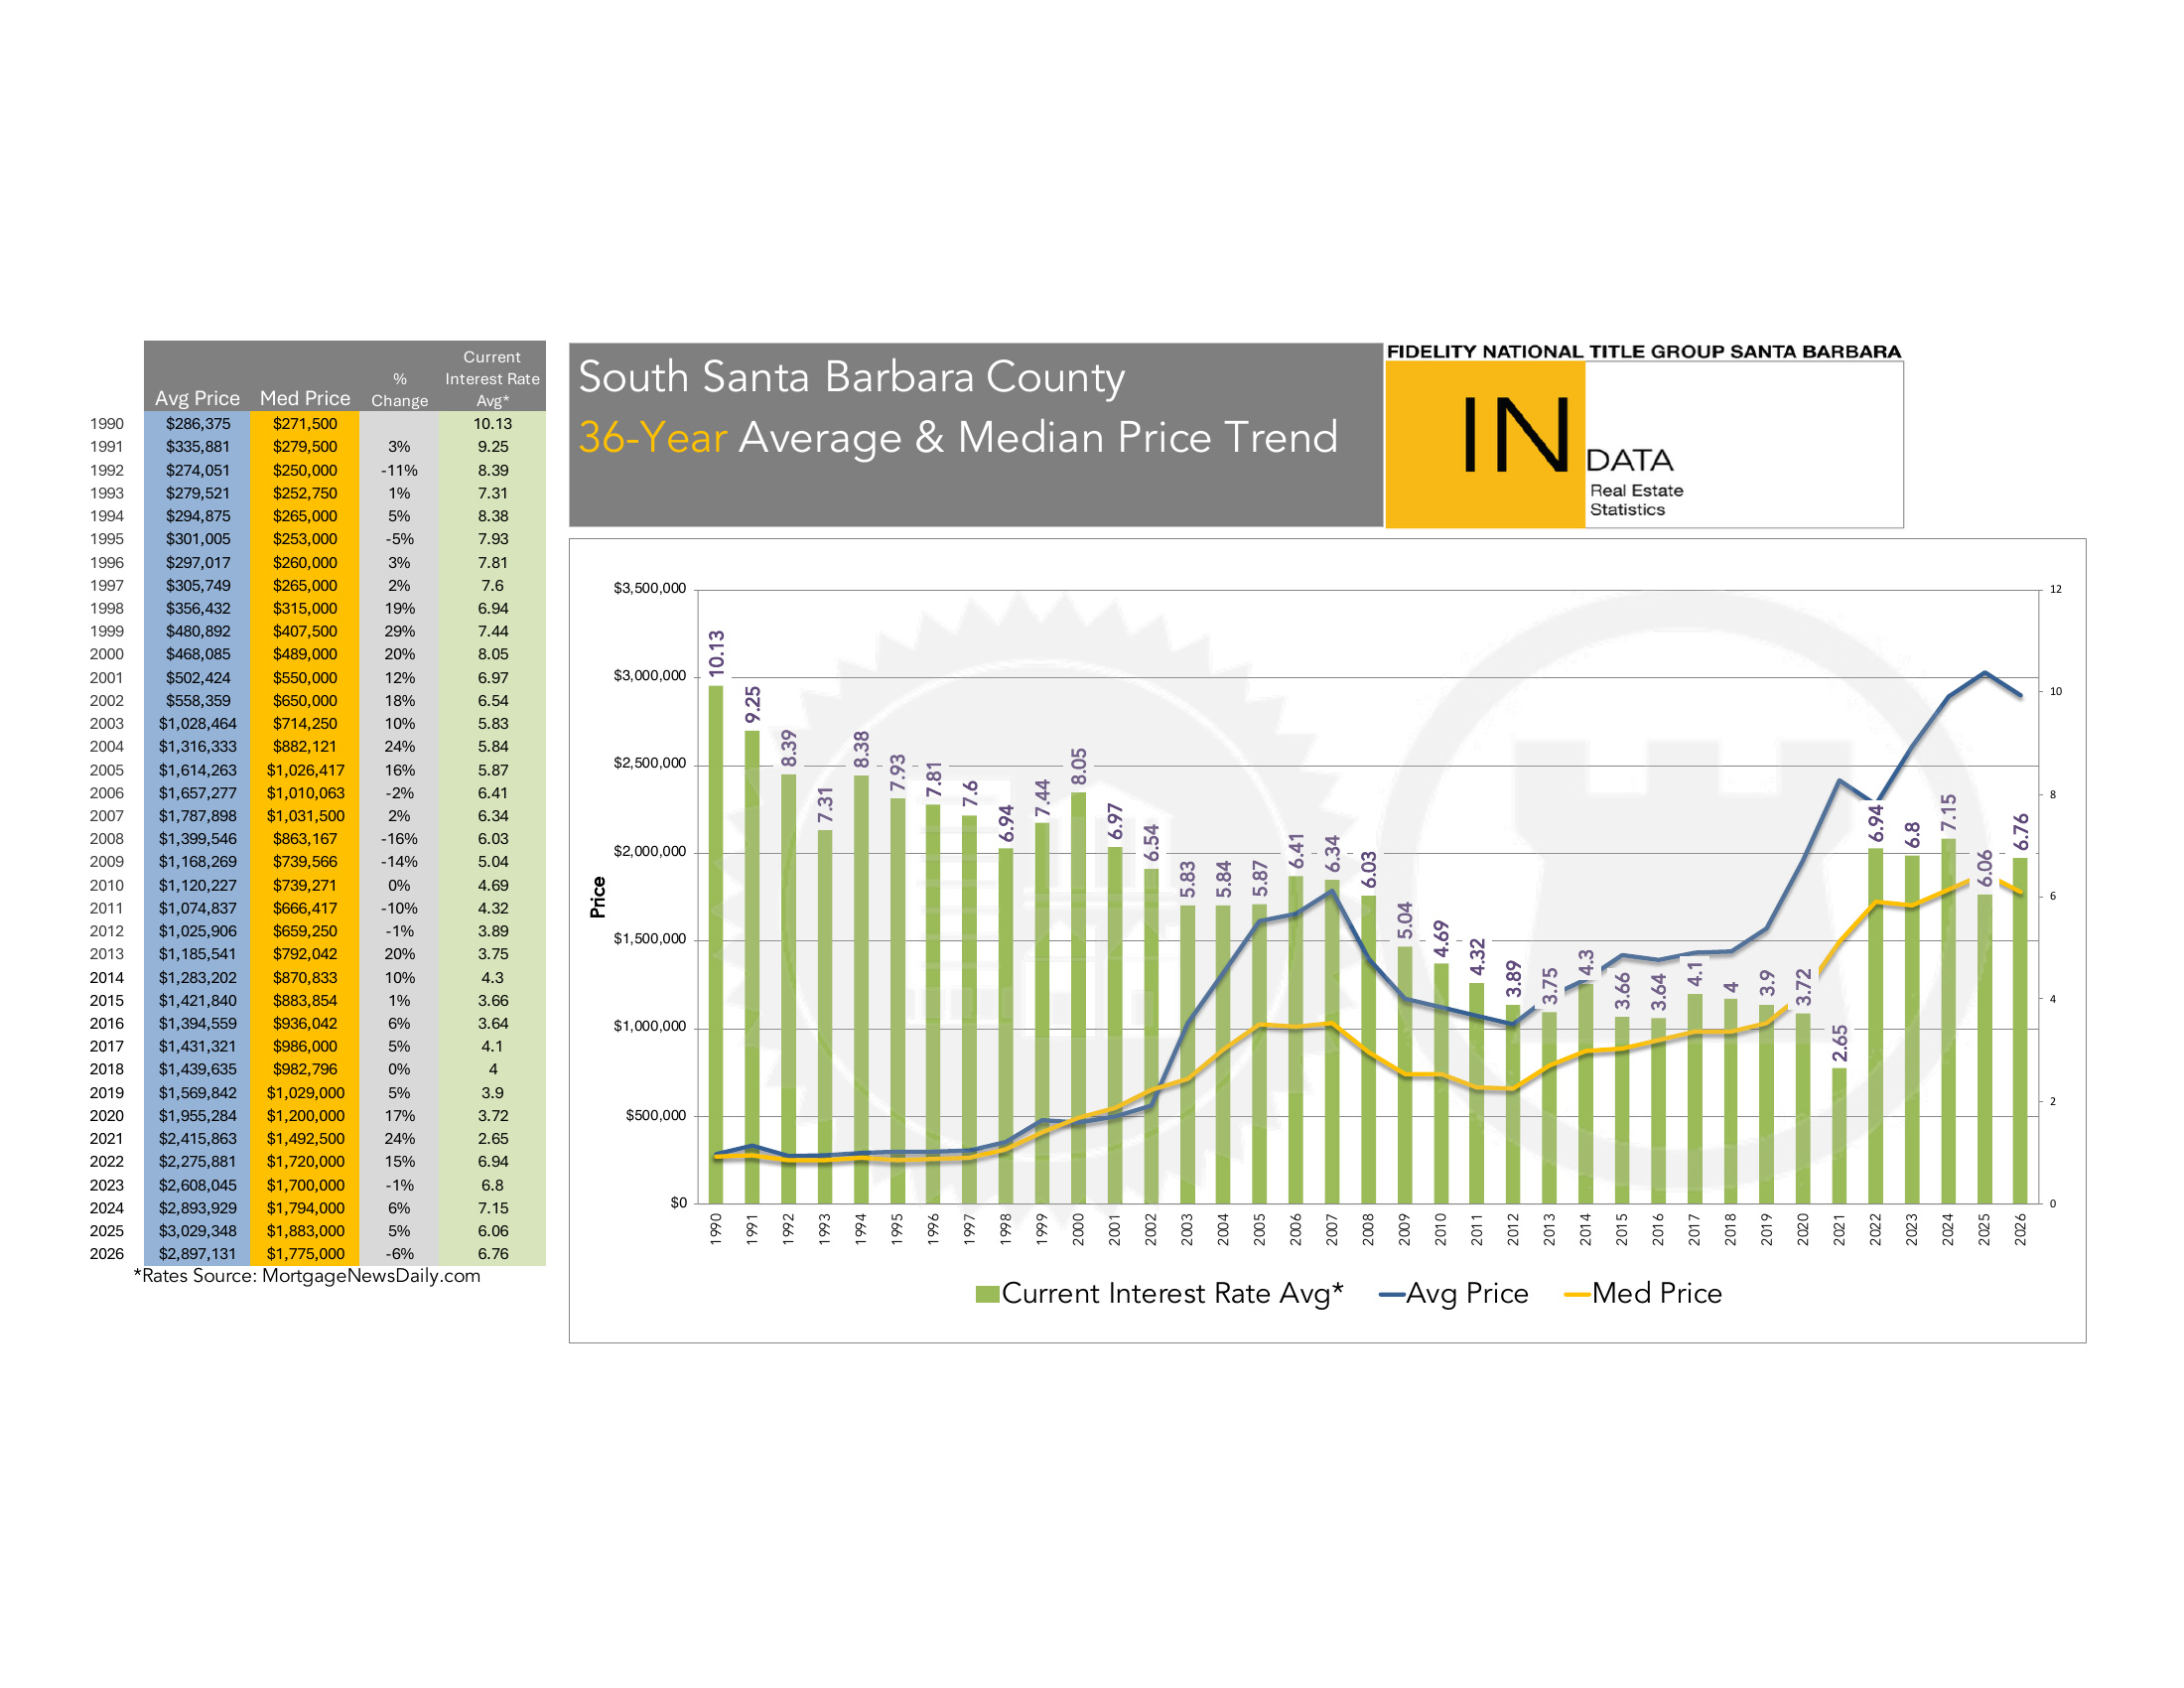
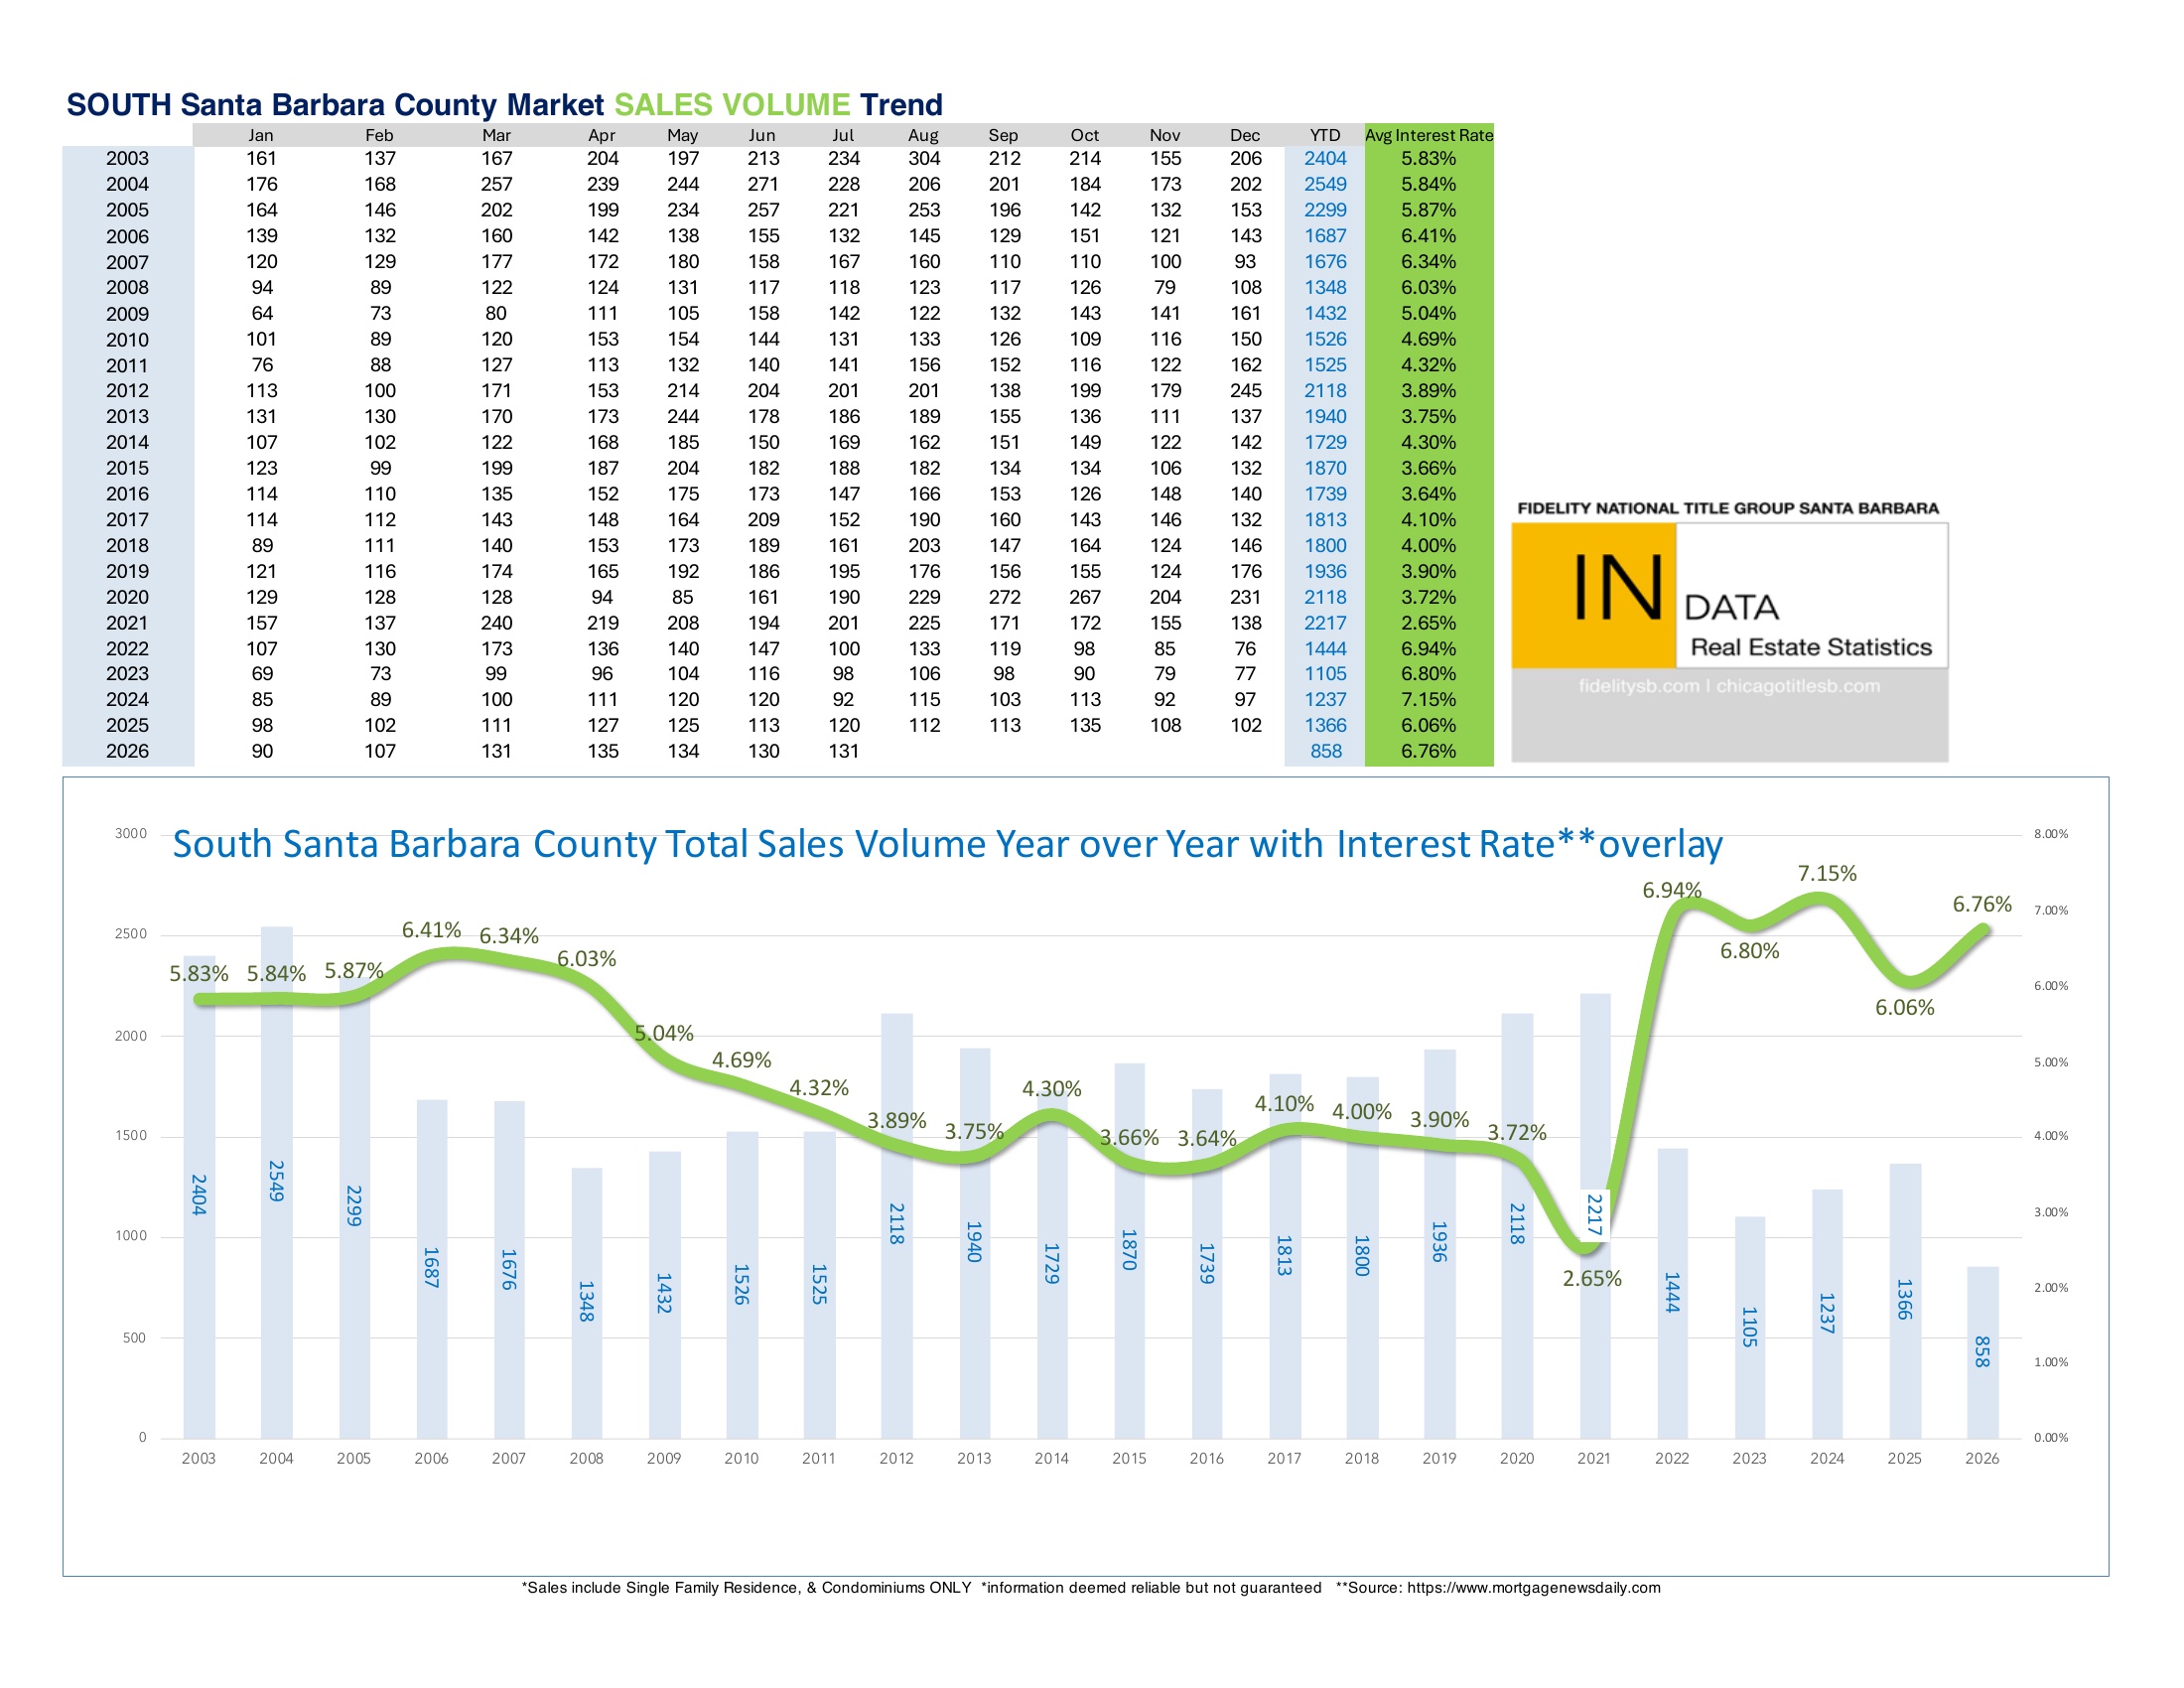
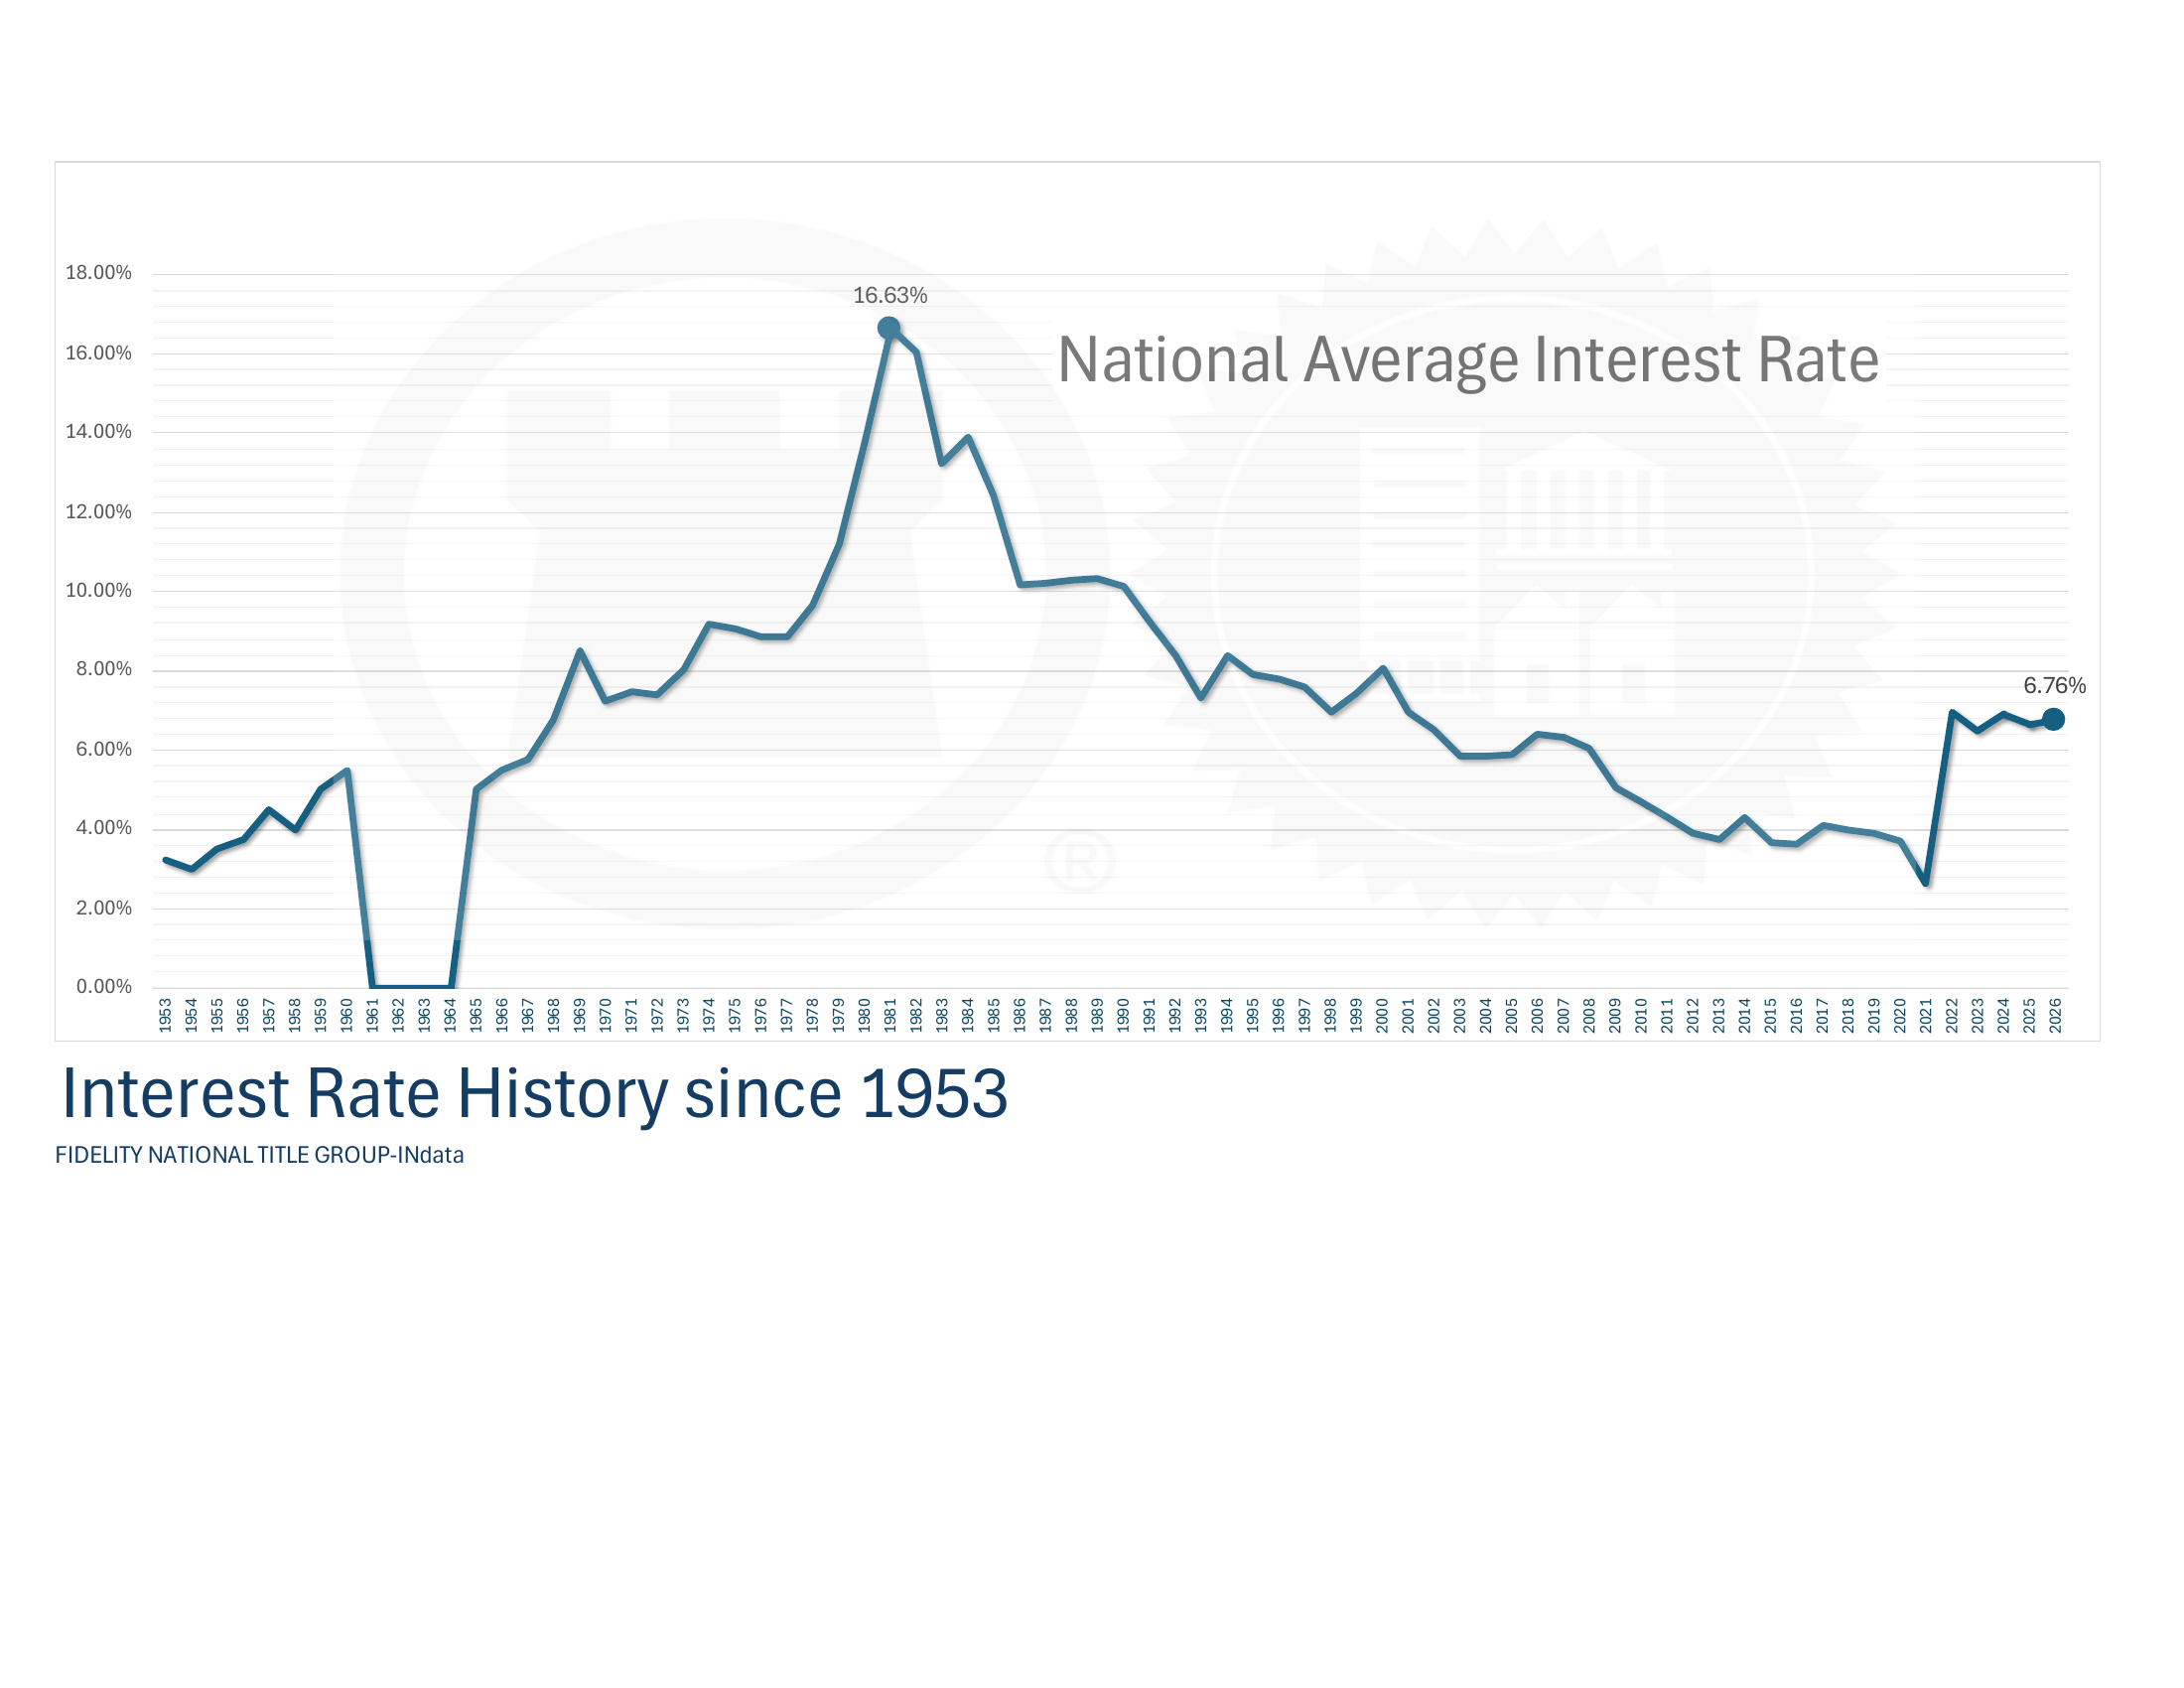
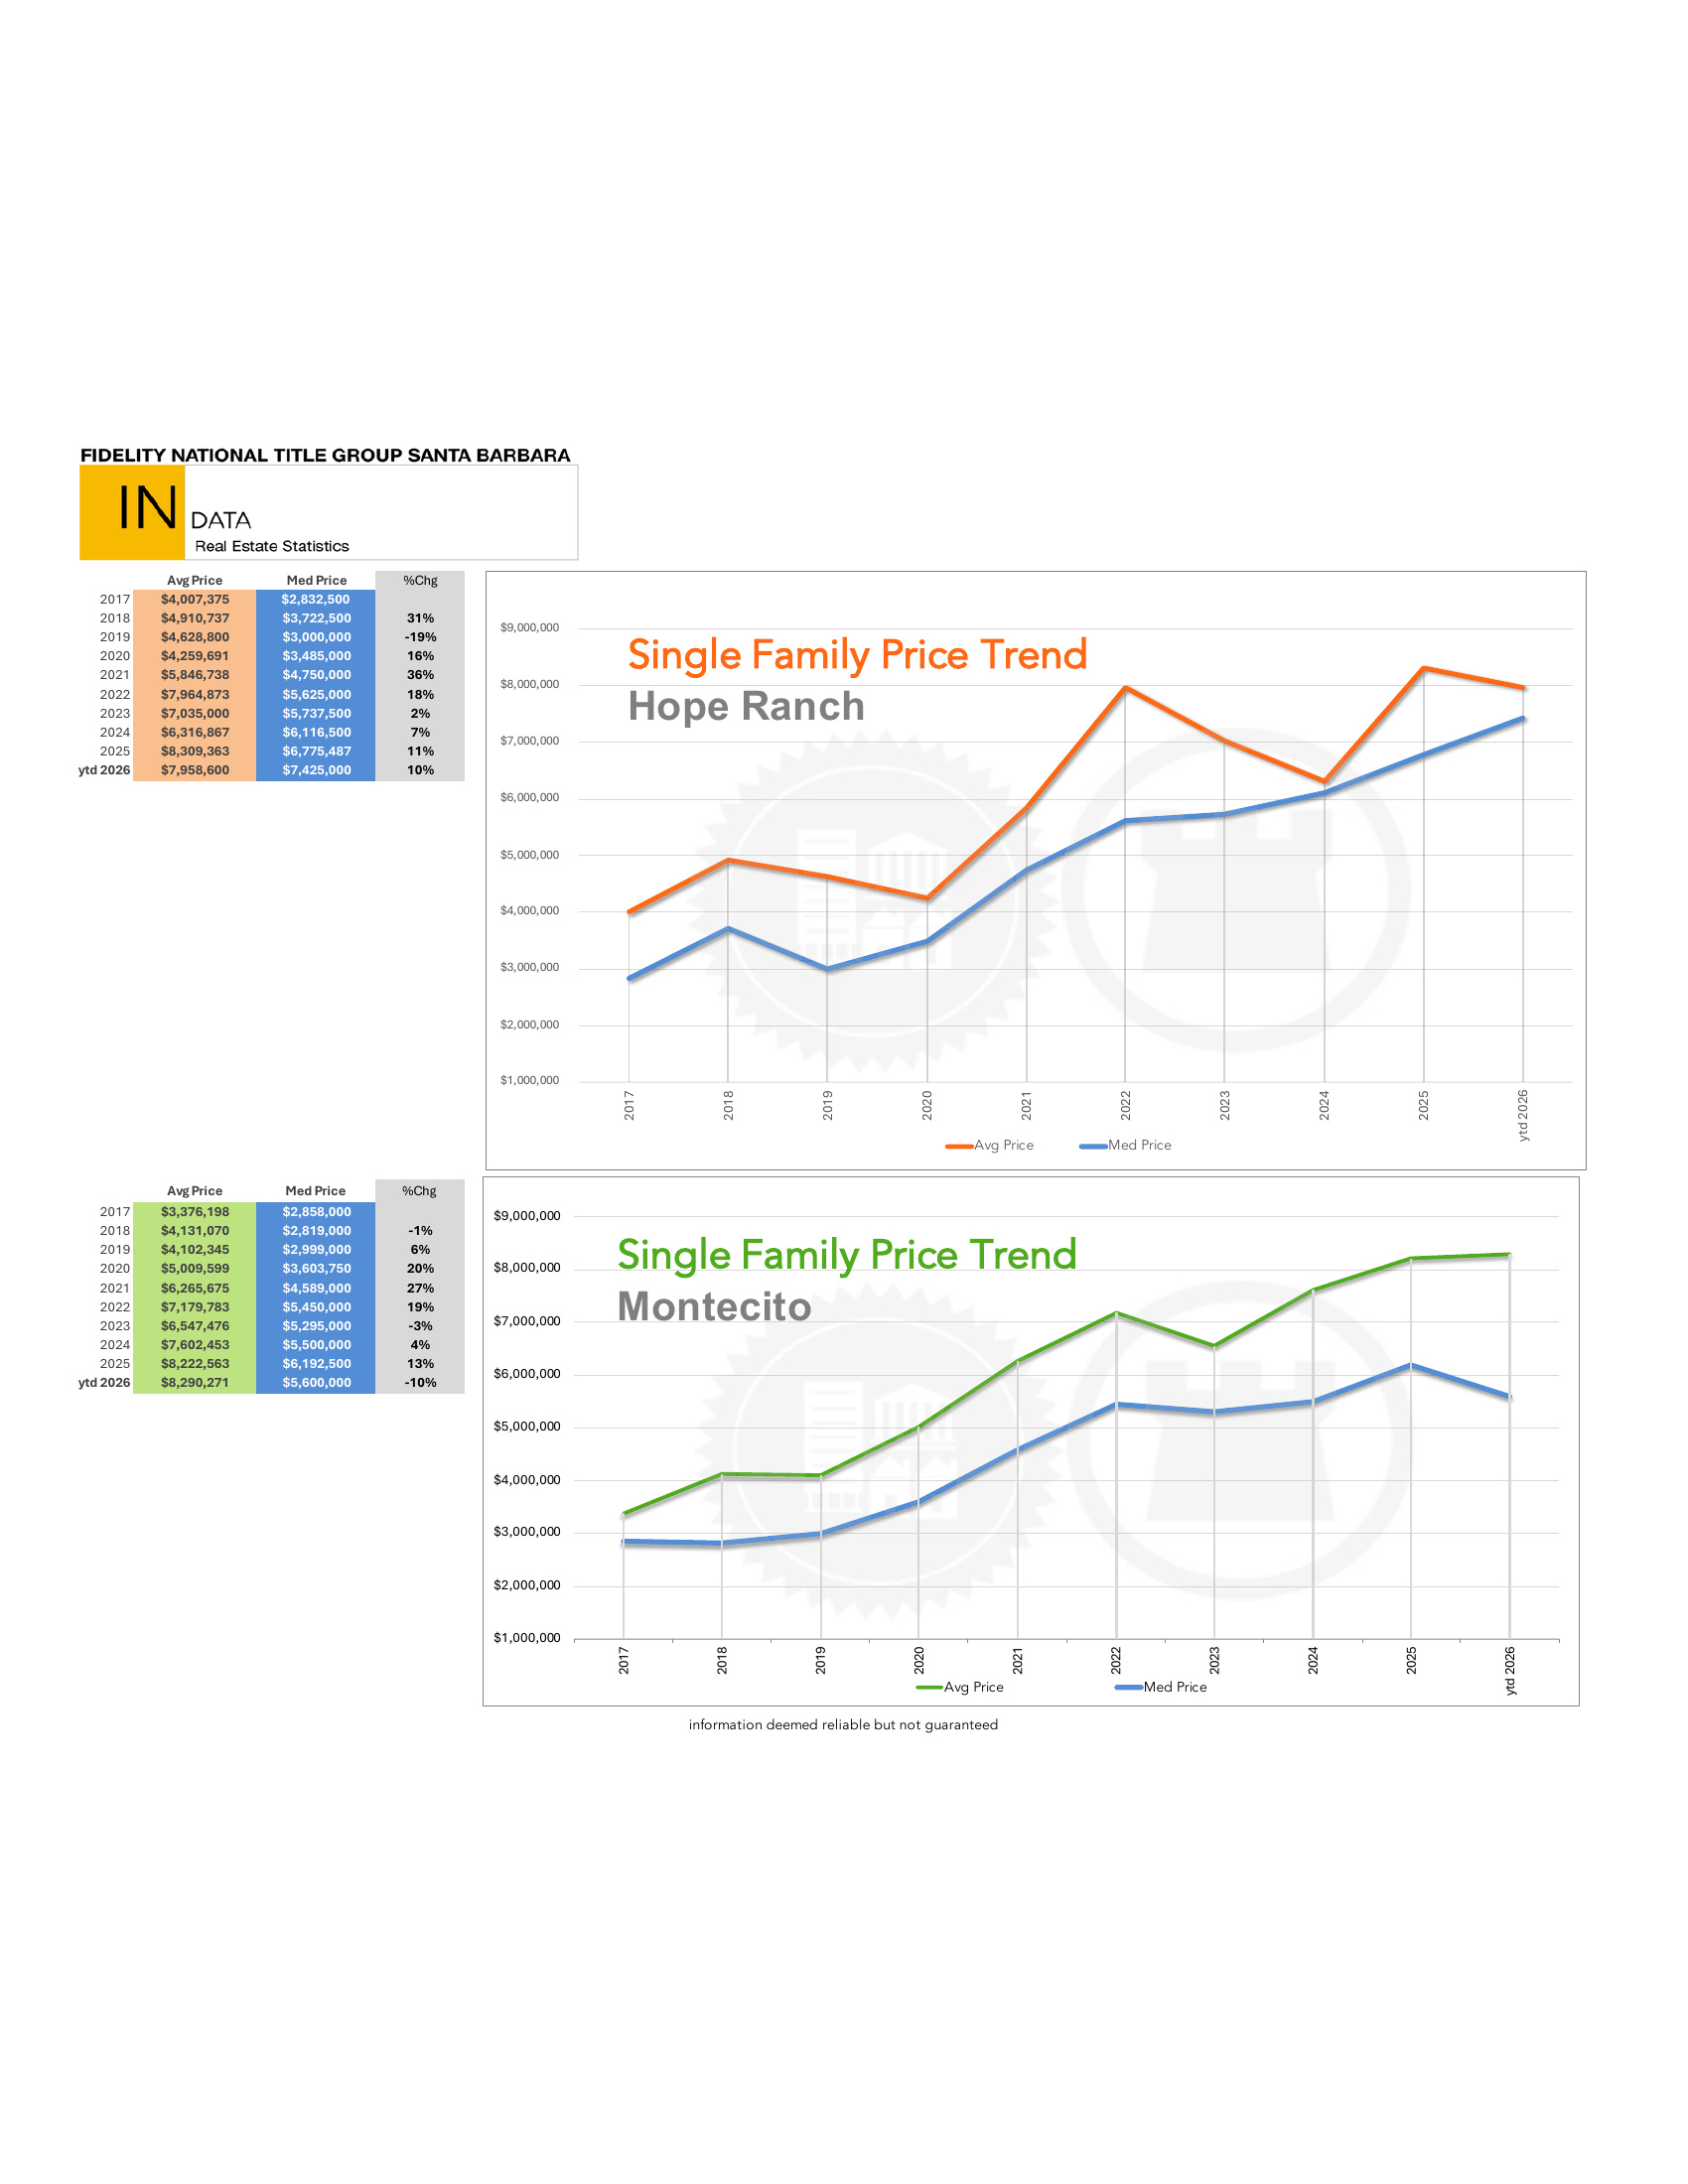
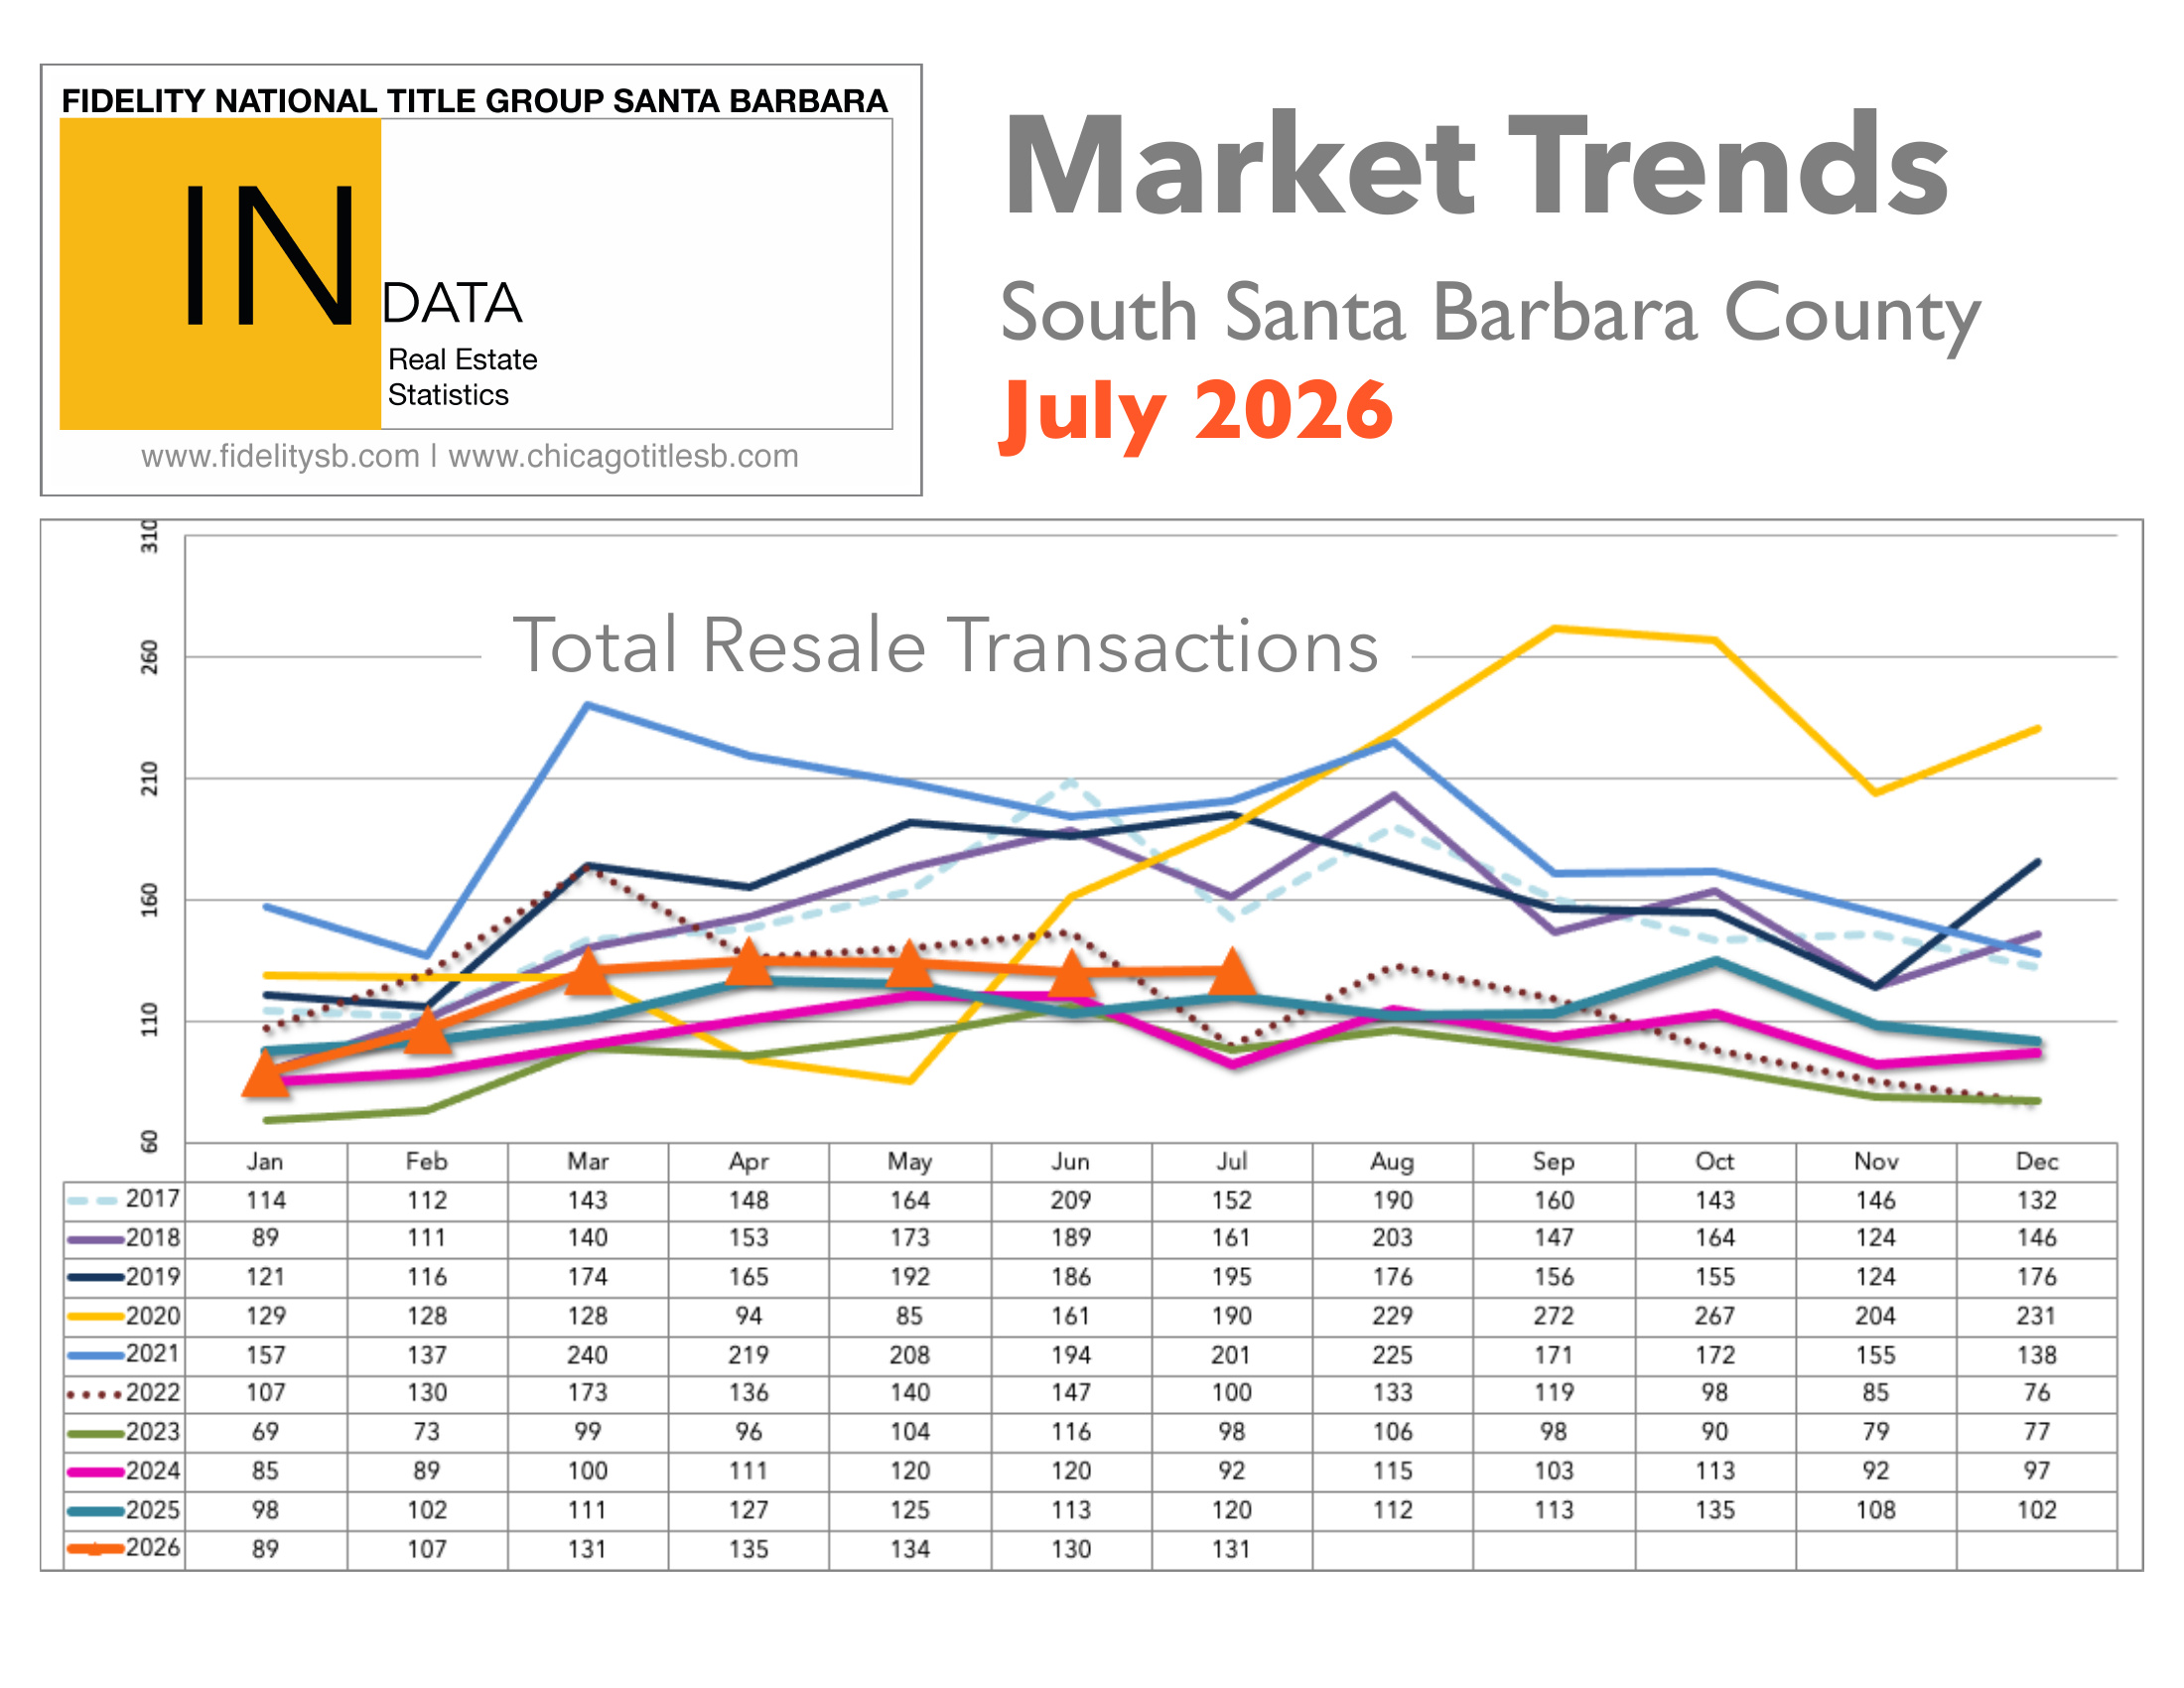
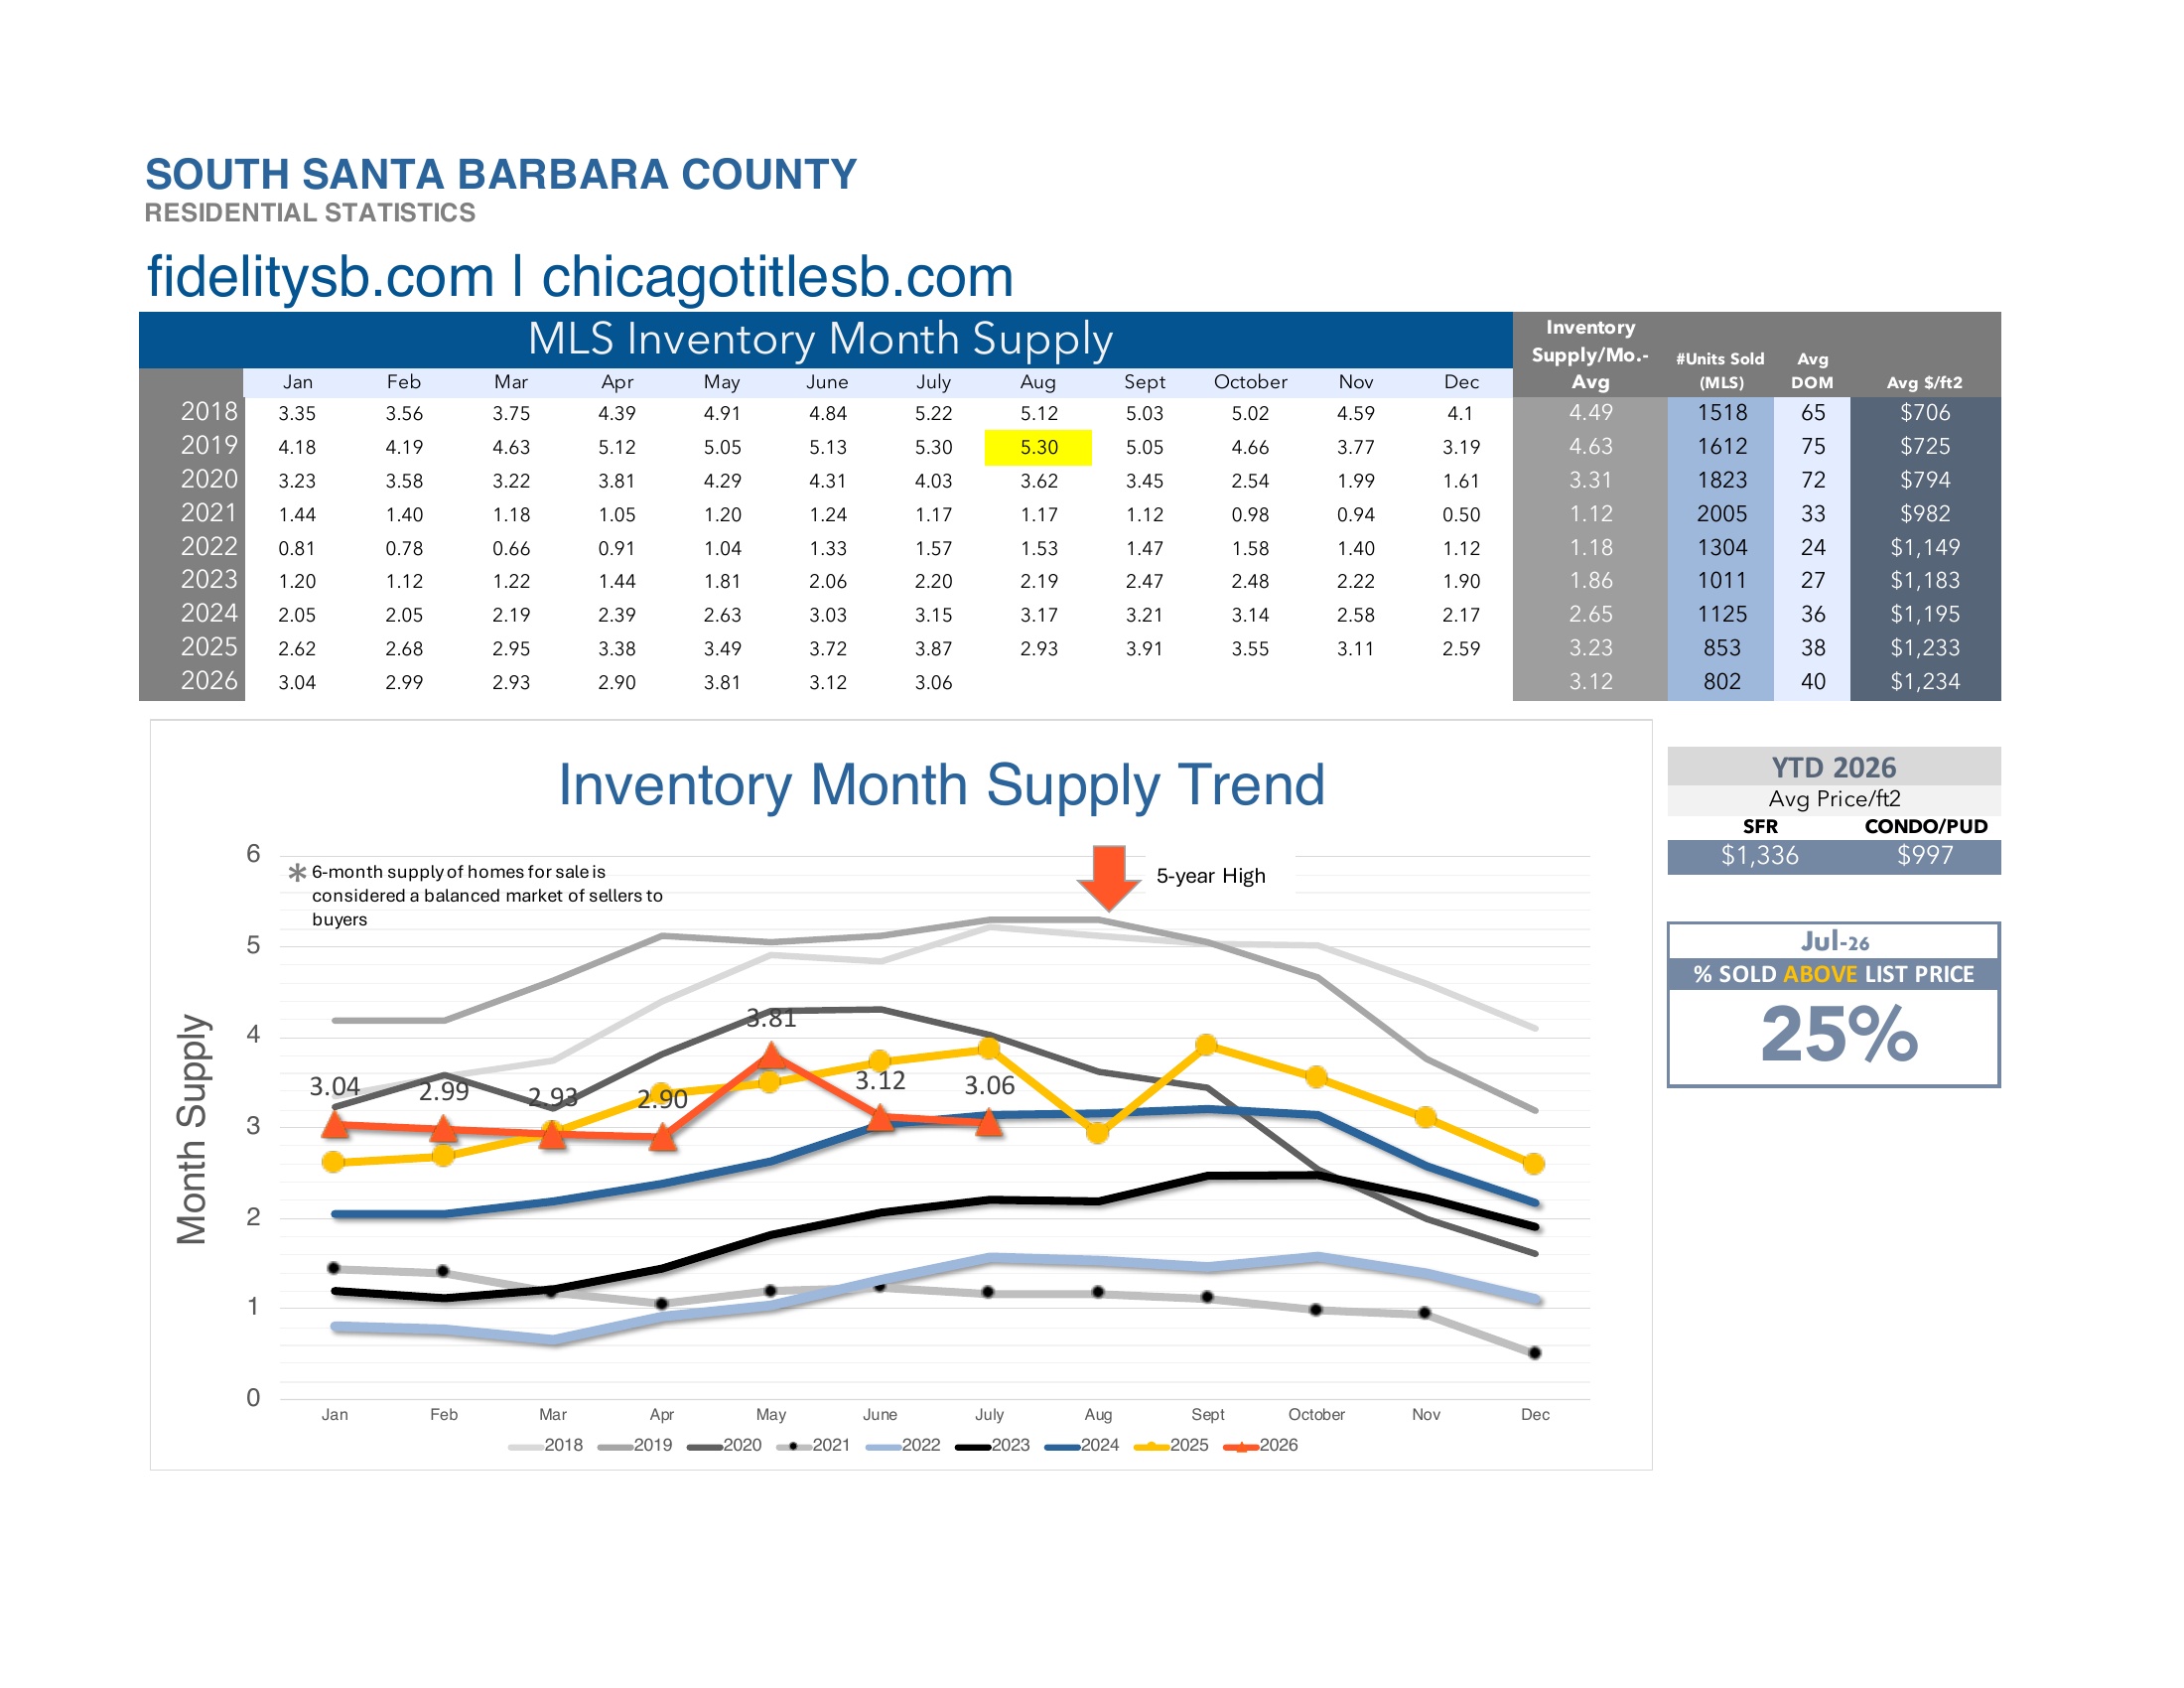
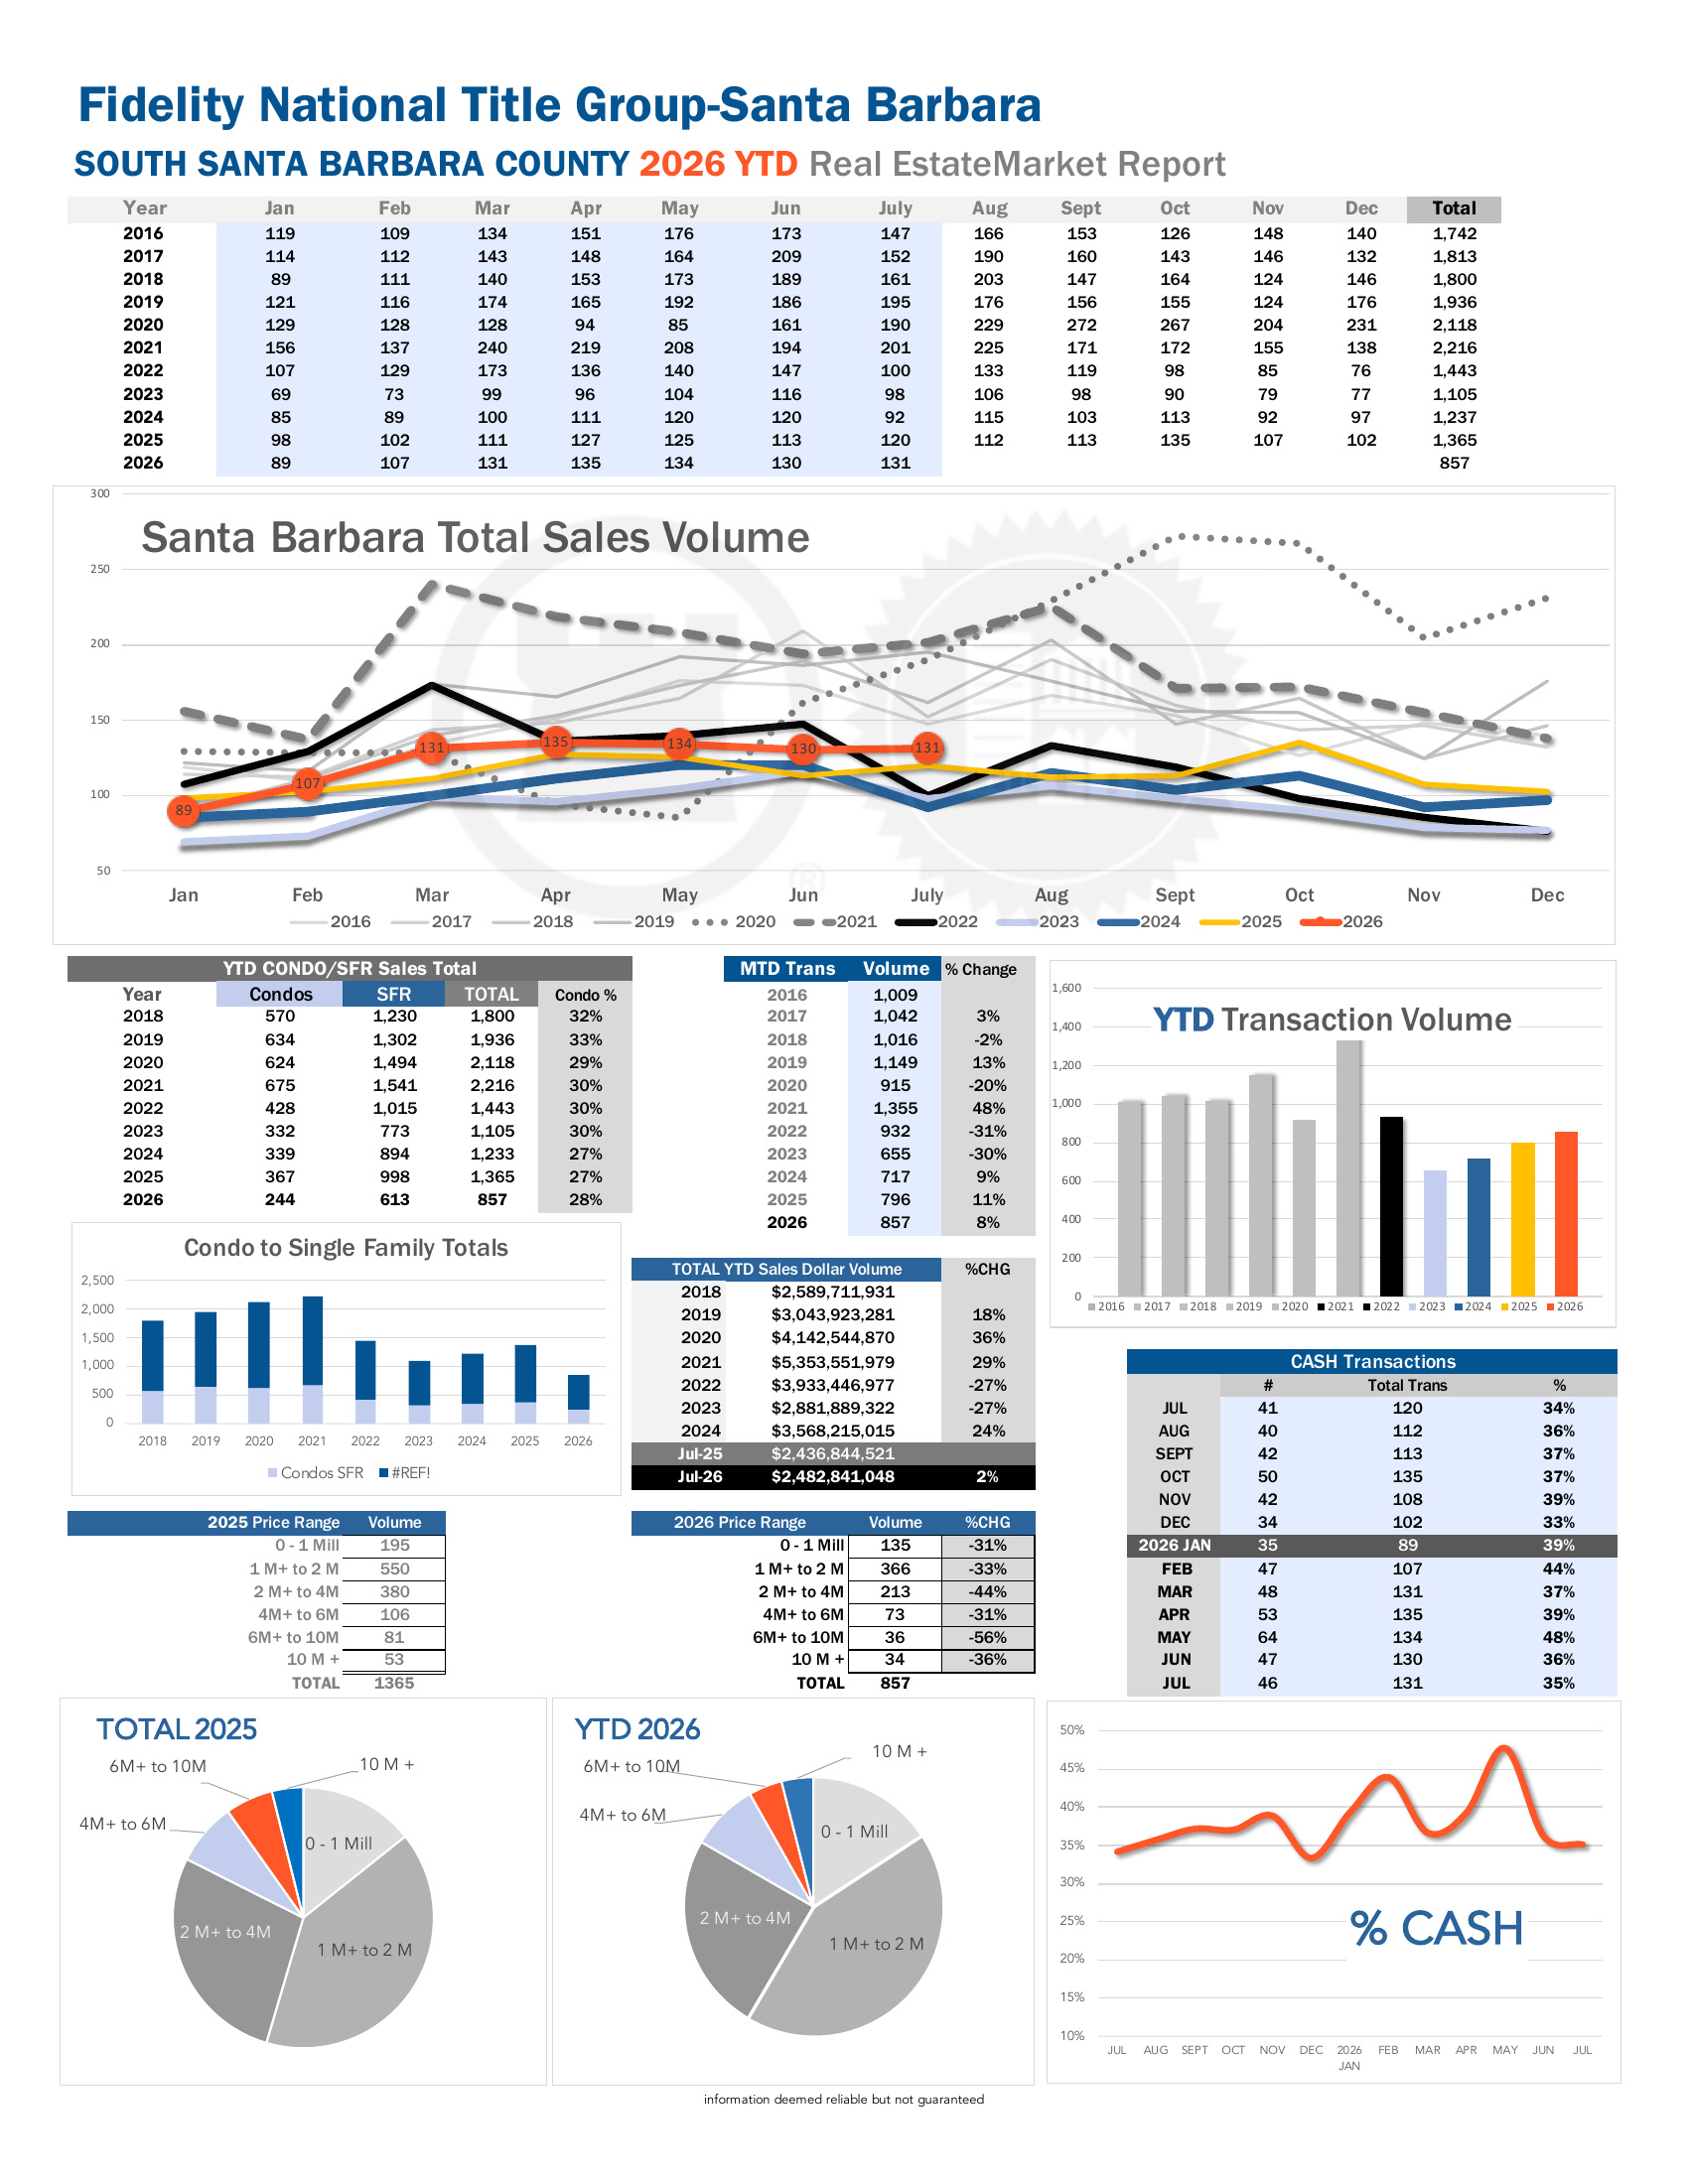
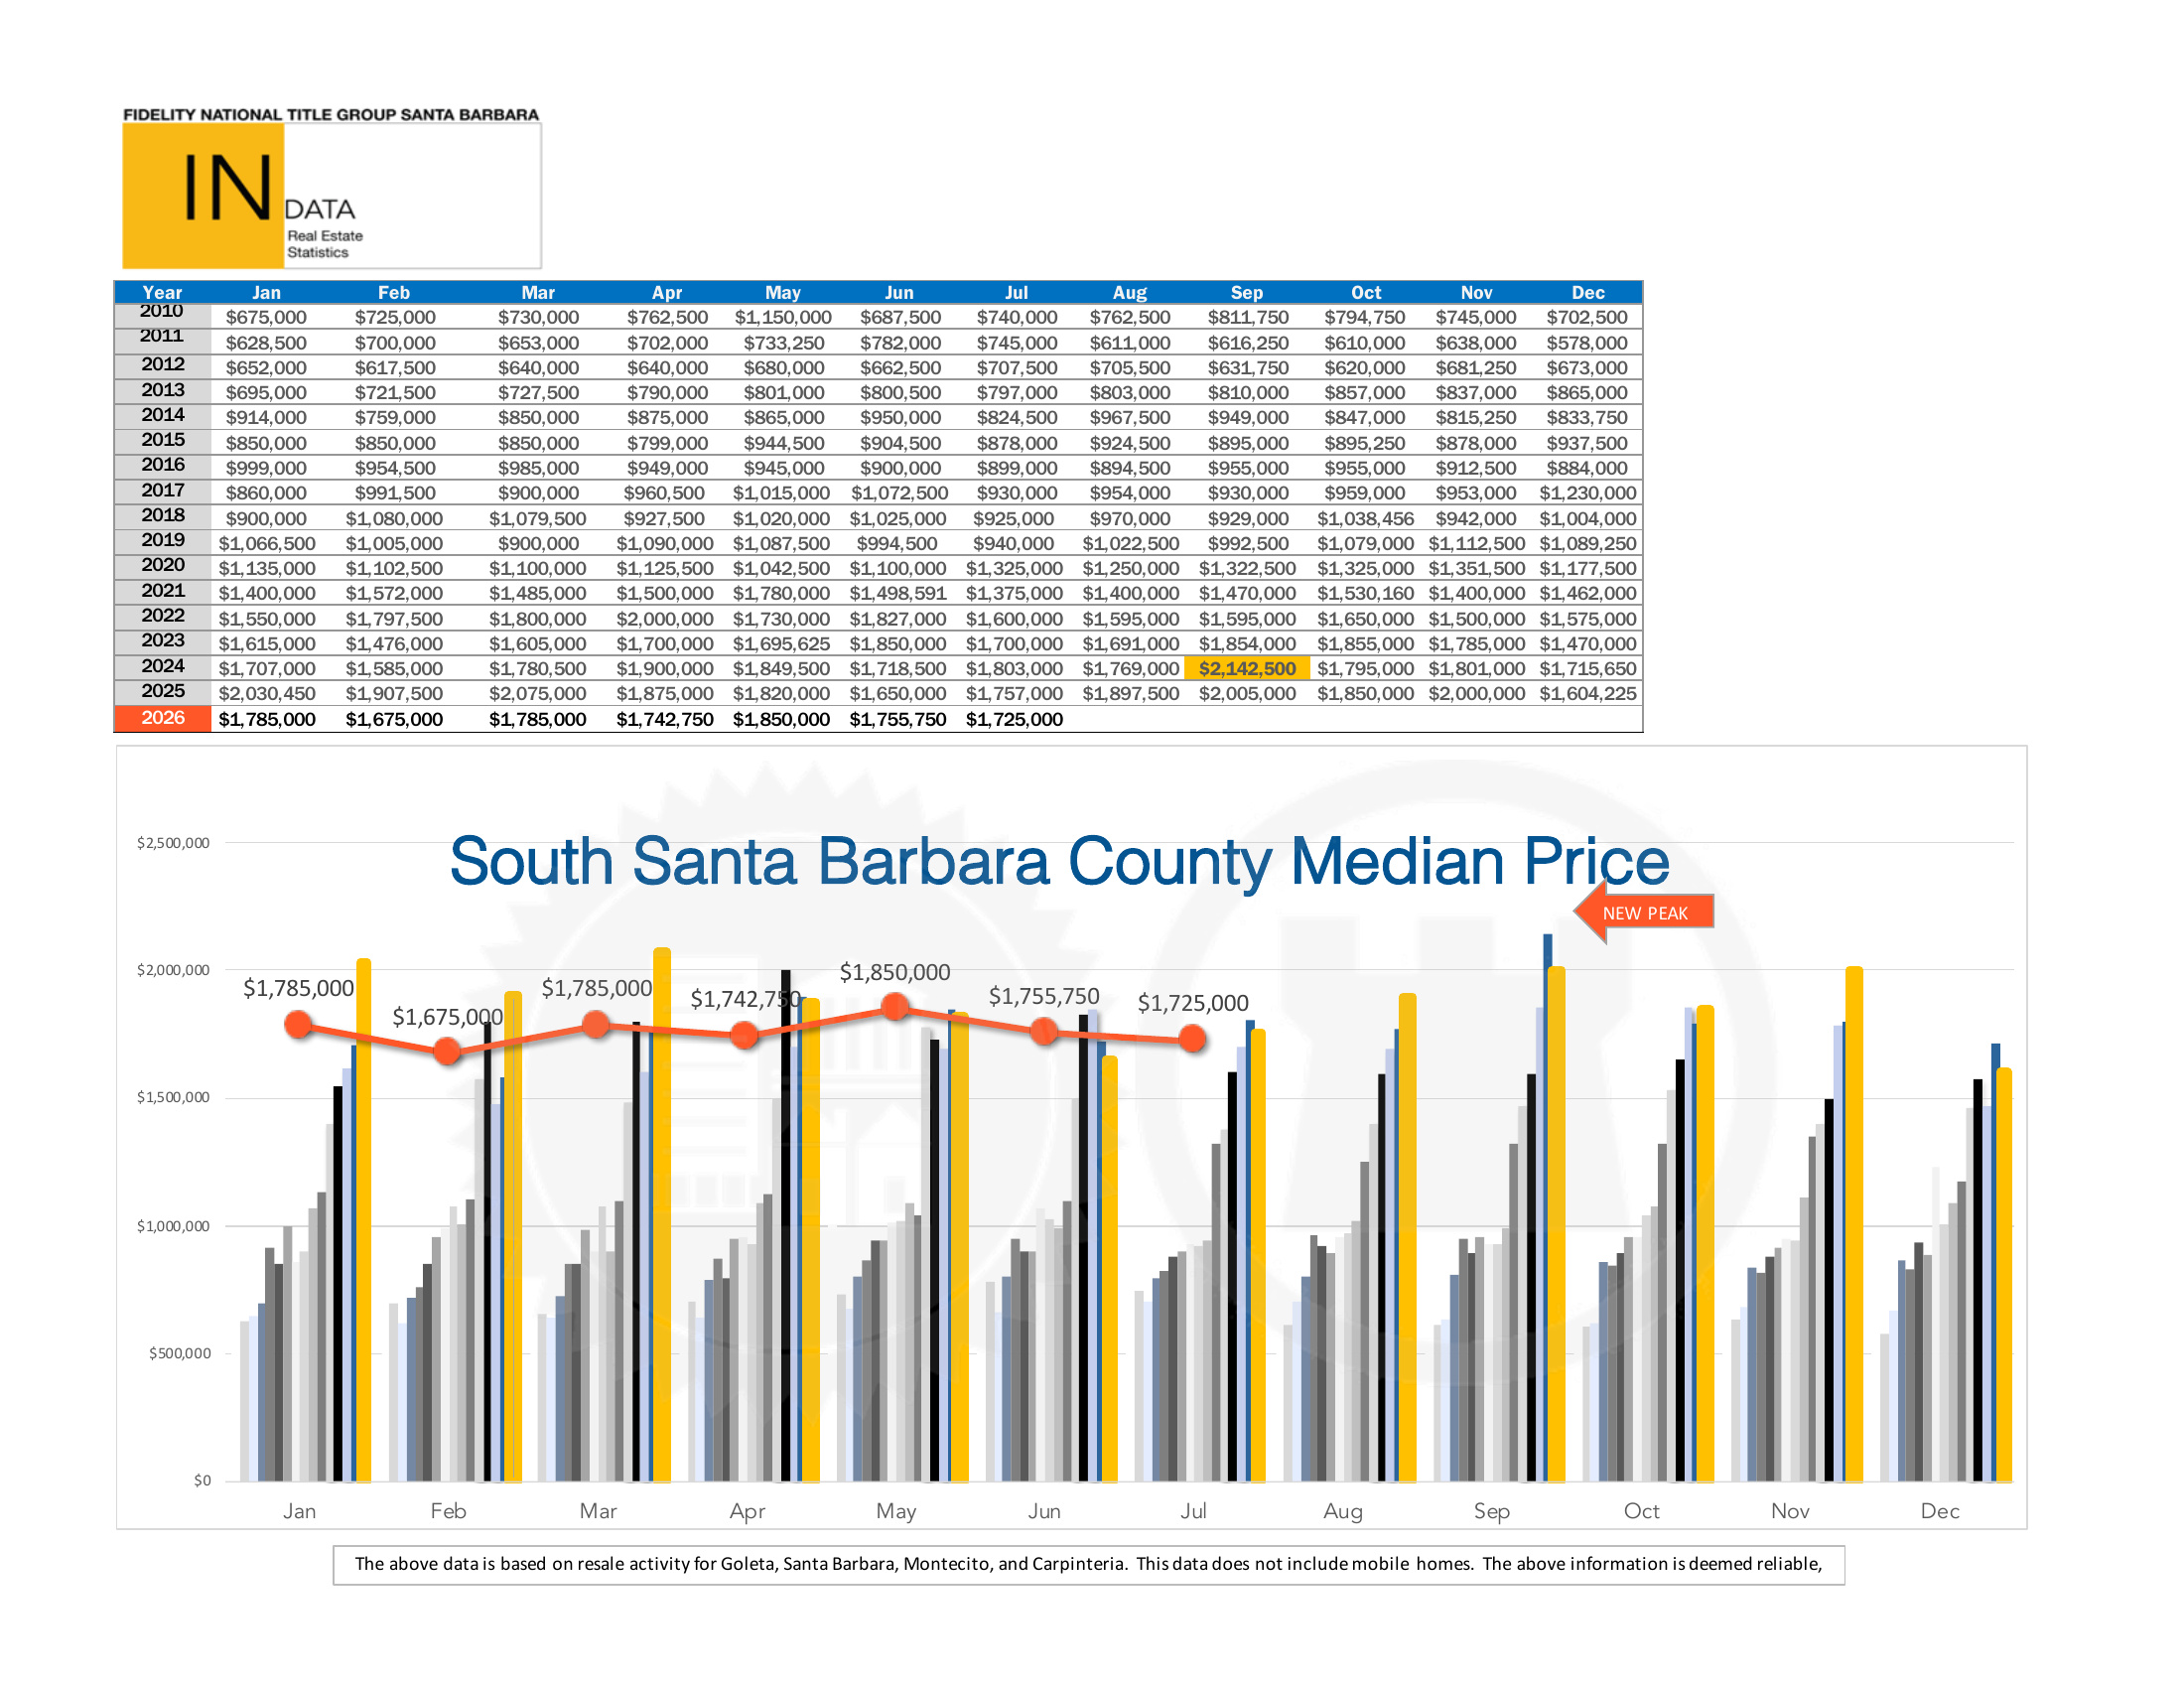
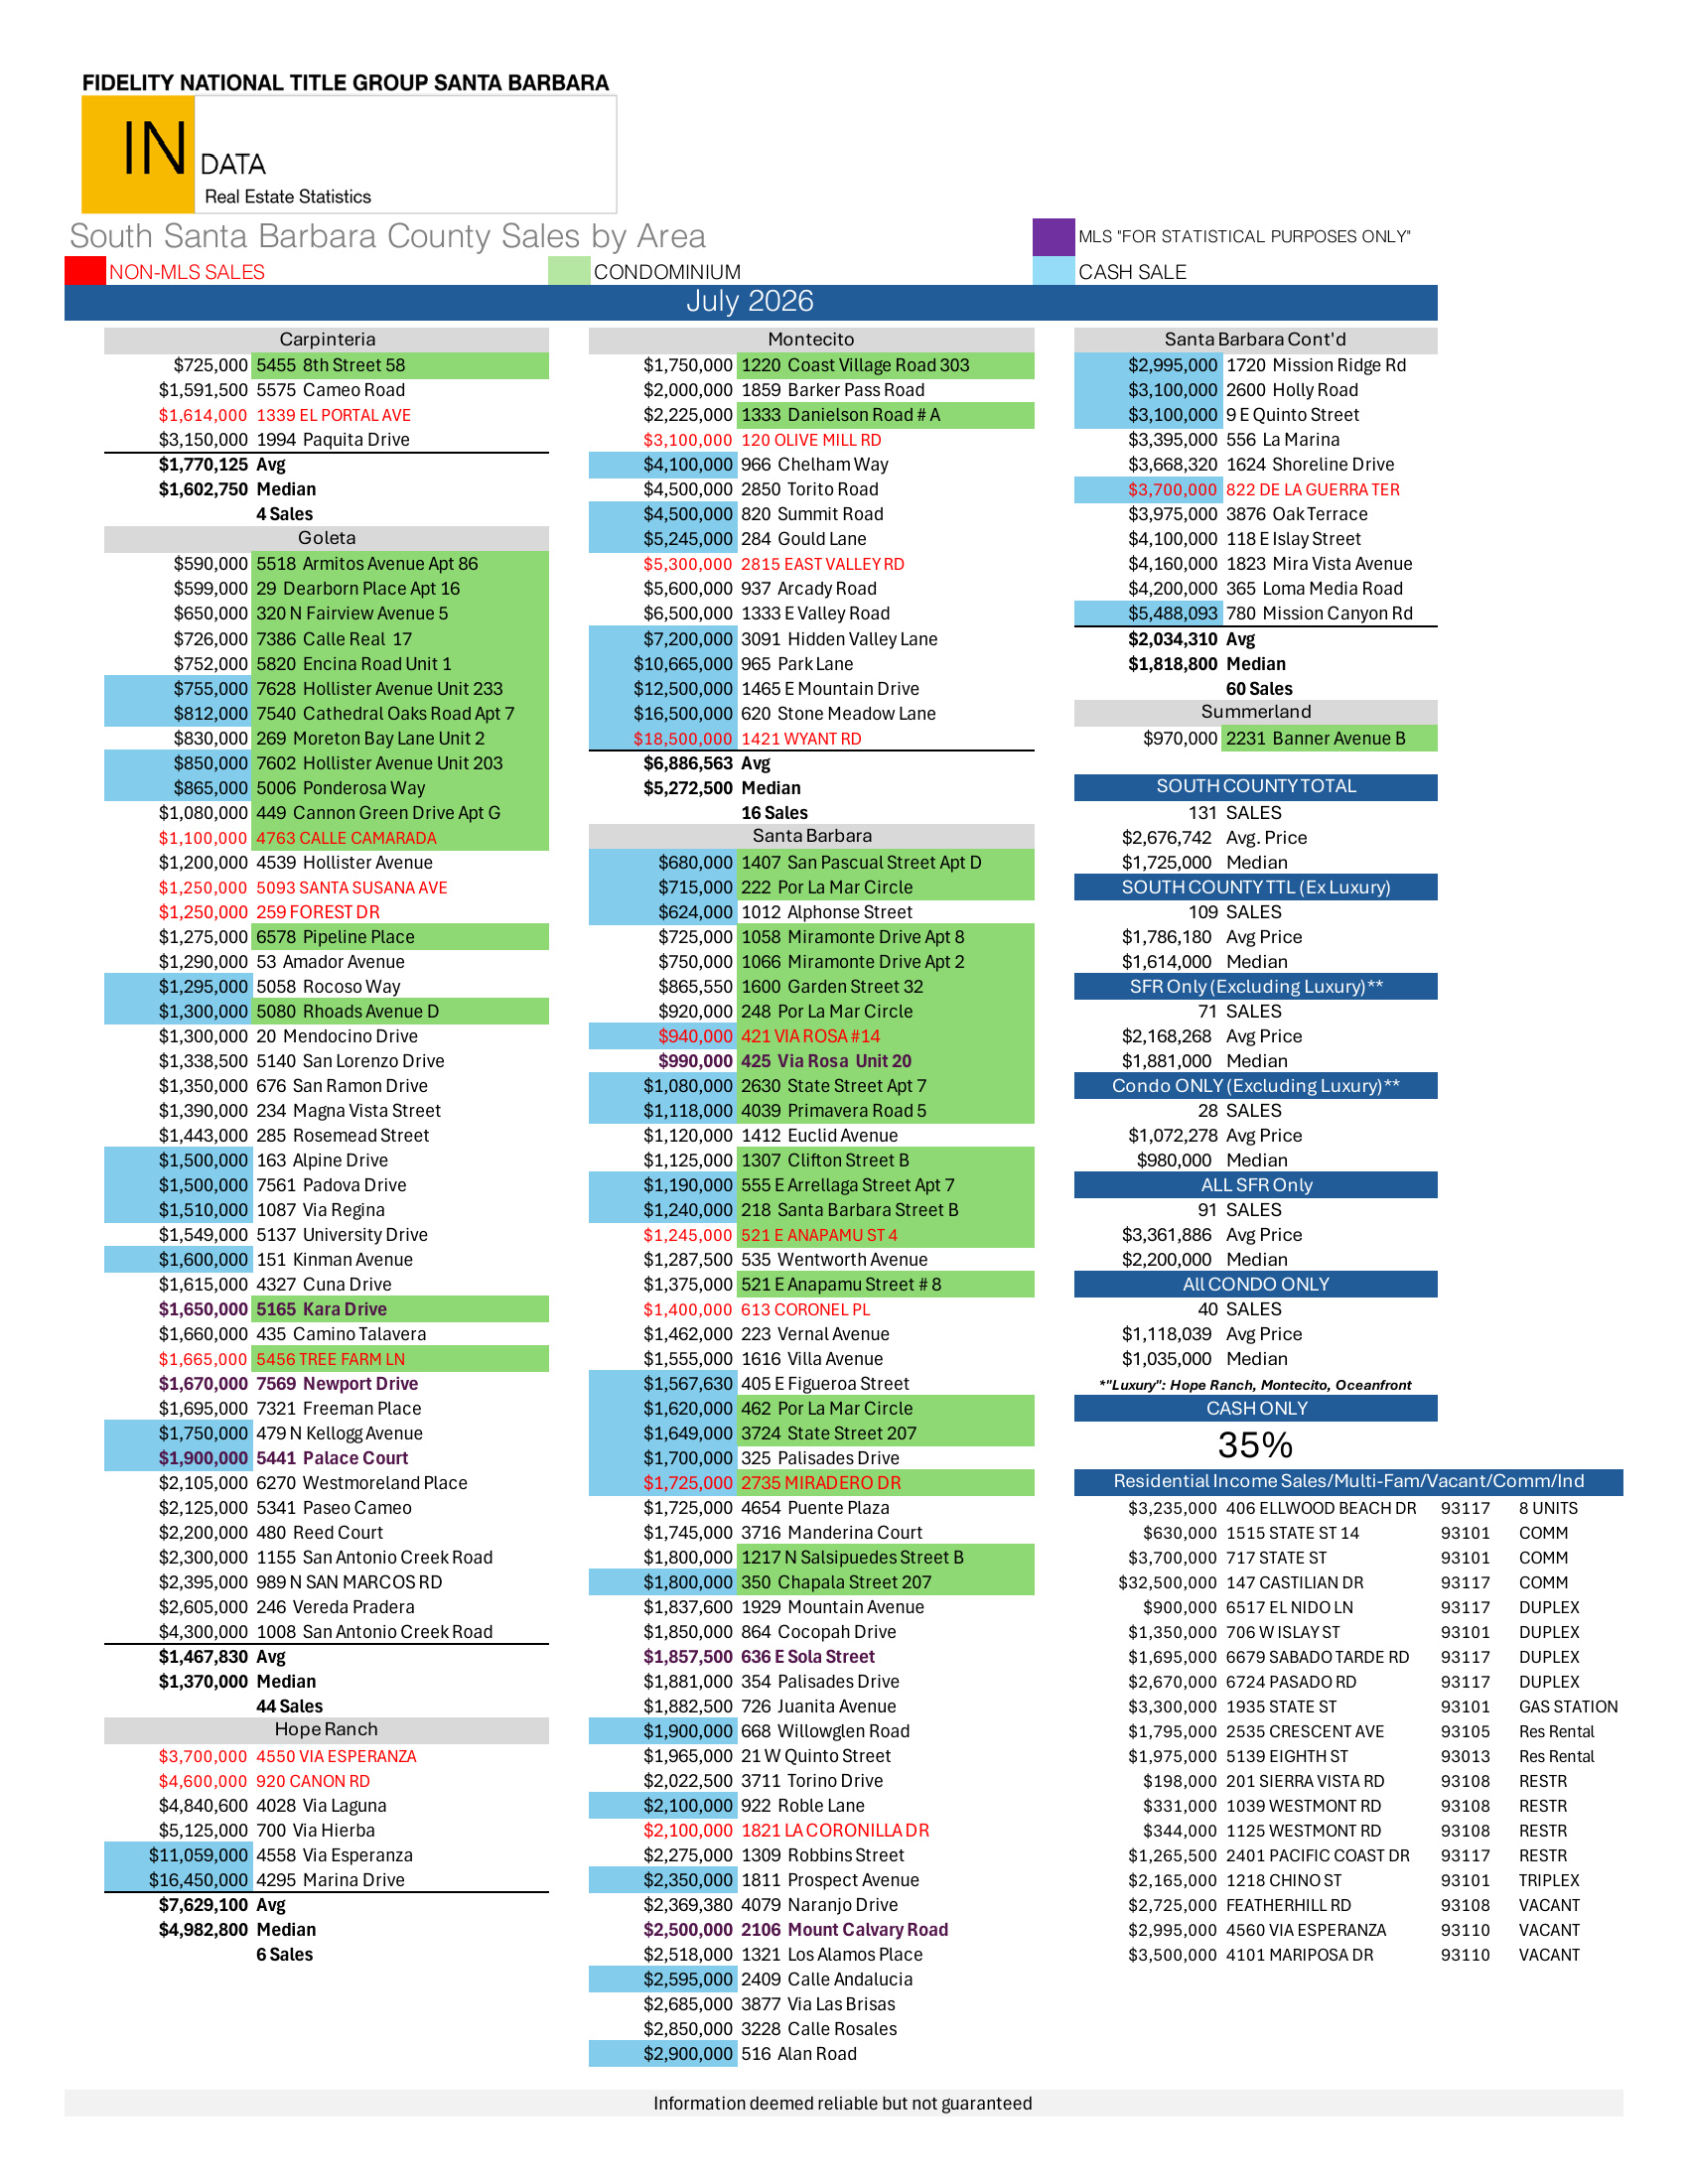
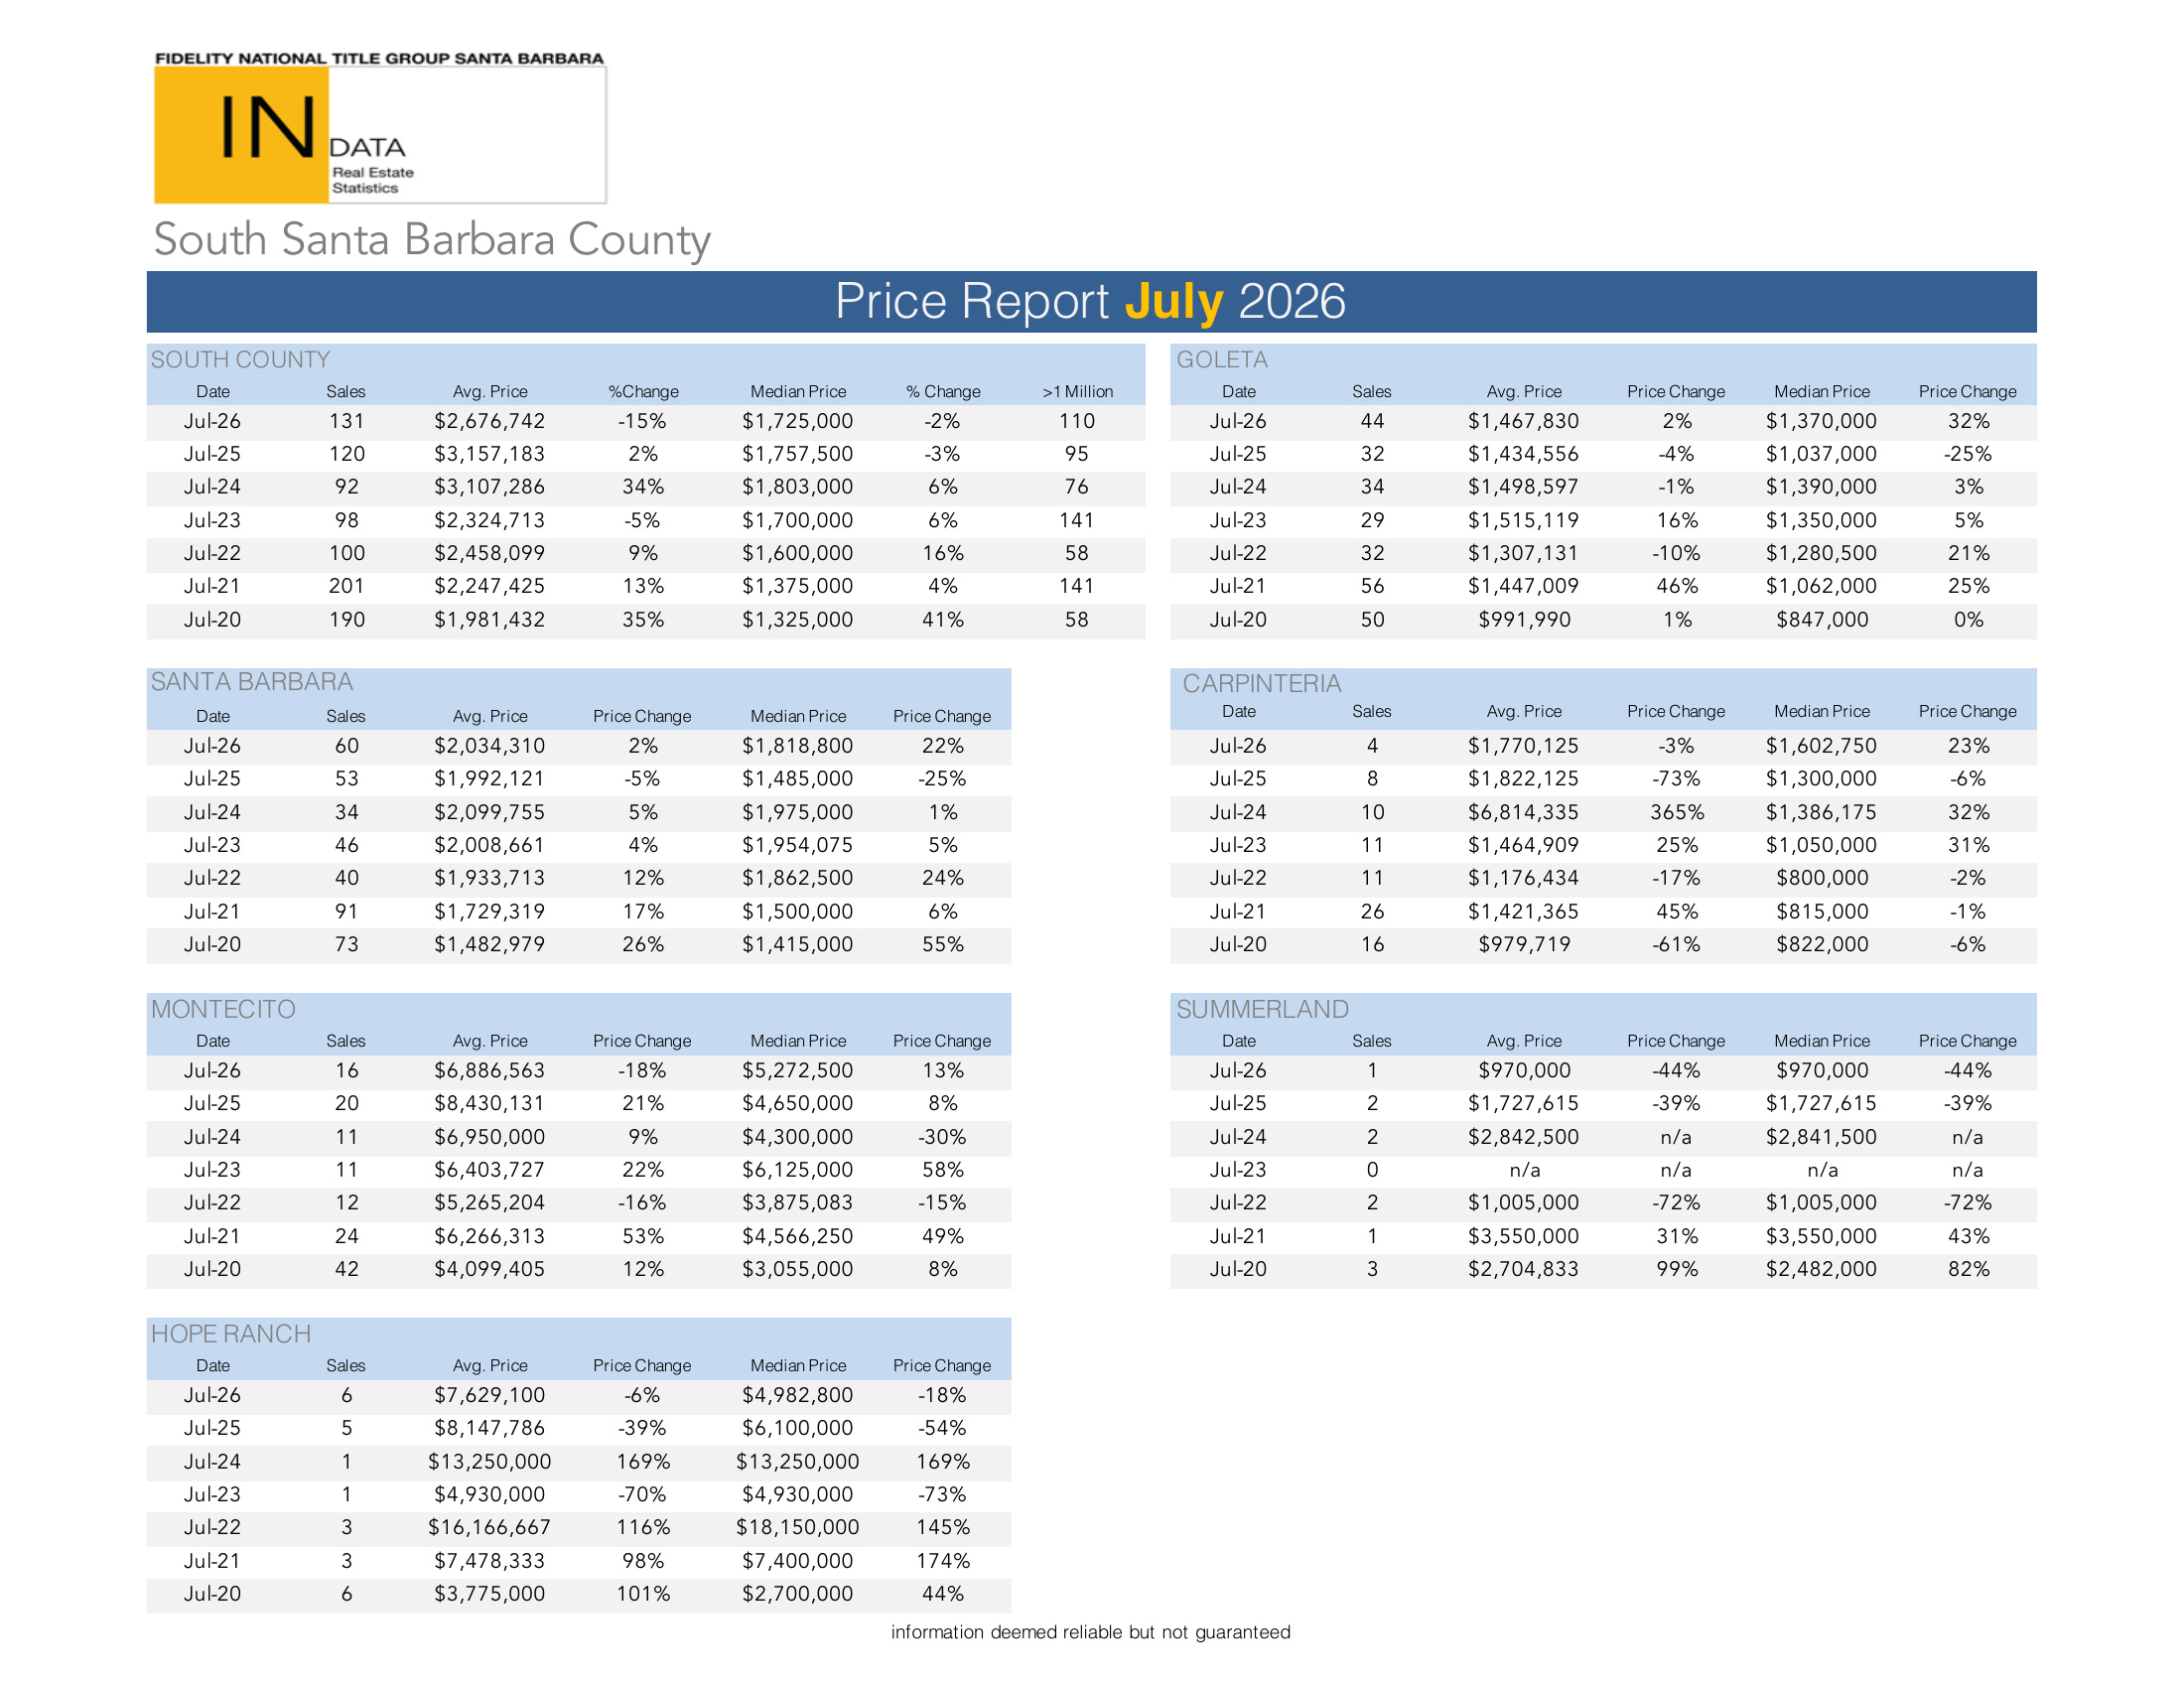
South Santa Barbara County July 2026 residential market statistics infographic comparing home sales, prices, and inventory.Santa Ynez Valley July 2026 housing market infographic comparing year-to-date sales, prices, and inventory with 2025.South Santa Barbara County July 2026 year-to-date housing statistics comparing single-family homes and condominiums.South Santa Barbara County single-family and condominium average and median price trends, 2016–2026 YTD.South Santa Barbara County chart of average and median home prices and interest rates from 1990 to 2026.South Santa Barbara County sales-volume chart, 2003–2026, with annual totals and average interest rates.Chart of national average interest rates from 1953 to 2026, peaking at 16.63% in 1981 and ending at 6.76%.Santa Barbara real estate price charts compare average and median single-family prices in Hope Ranch and Montecito.South Santa Barbara County resale transactions by month, 2017–2026, with 2026 data through July.Montecito 2026 market report dashboard with sales, pricing, transaction volume, price ranges, and cash-sale statistics.2026 Montecito real estate report with median price and days-on-market charts.South Santa Barbara County housing statistics table and chart comparing monthly inventory supply trends from 2018 to 2026.Santa Barbara County 2026 year-to-date real estate market statistics dashboard.South Santa Barbara County median price chart with monthly prices by year and an orange line highlighting 2026.July 2026 South Santa Barbara County home sales statistics by area, with prices, averages, and medians.July 2026 South Santa Barbara County real estate price report with market tables for seven local areas.

Montecito Market Statistics

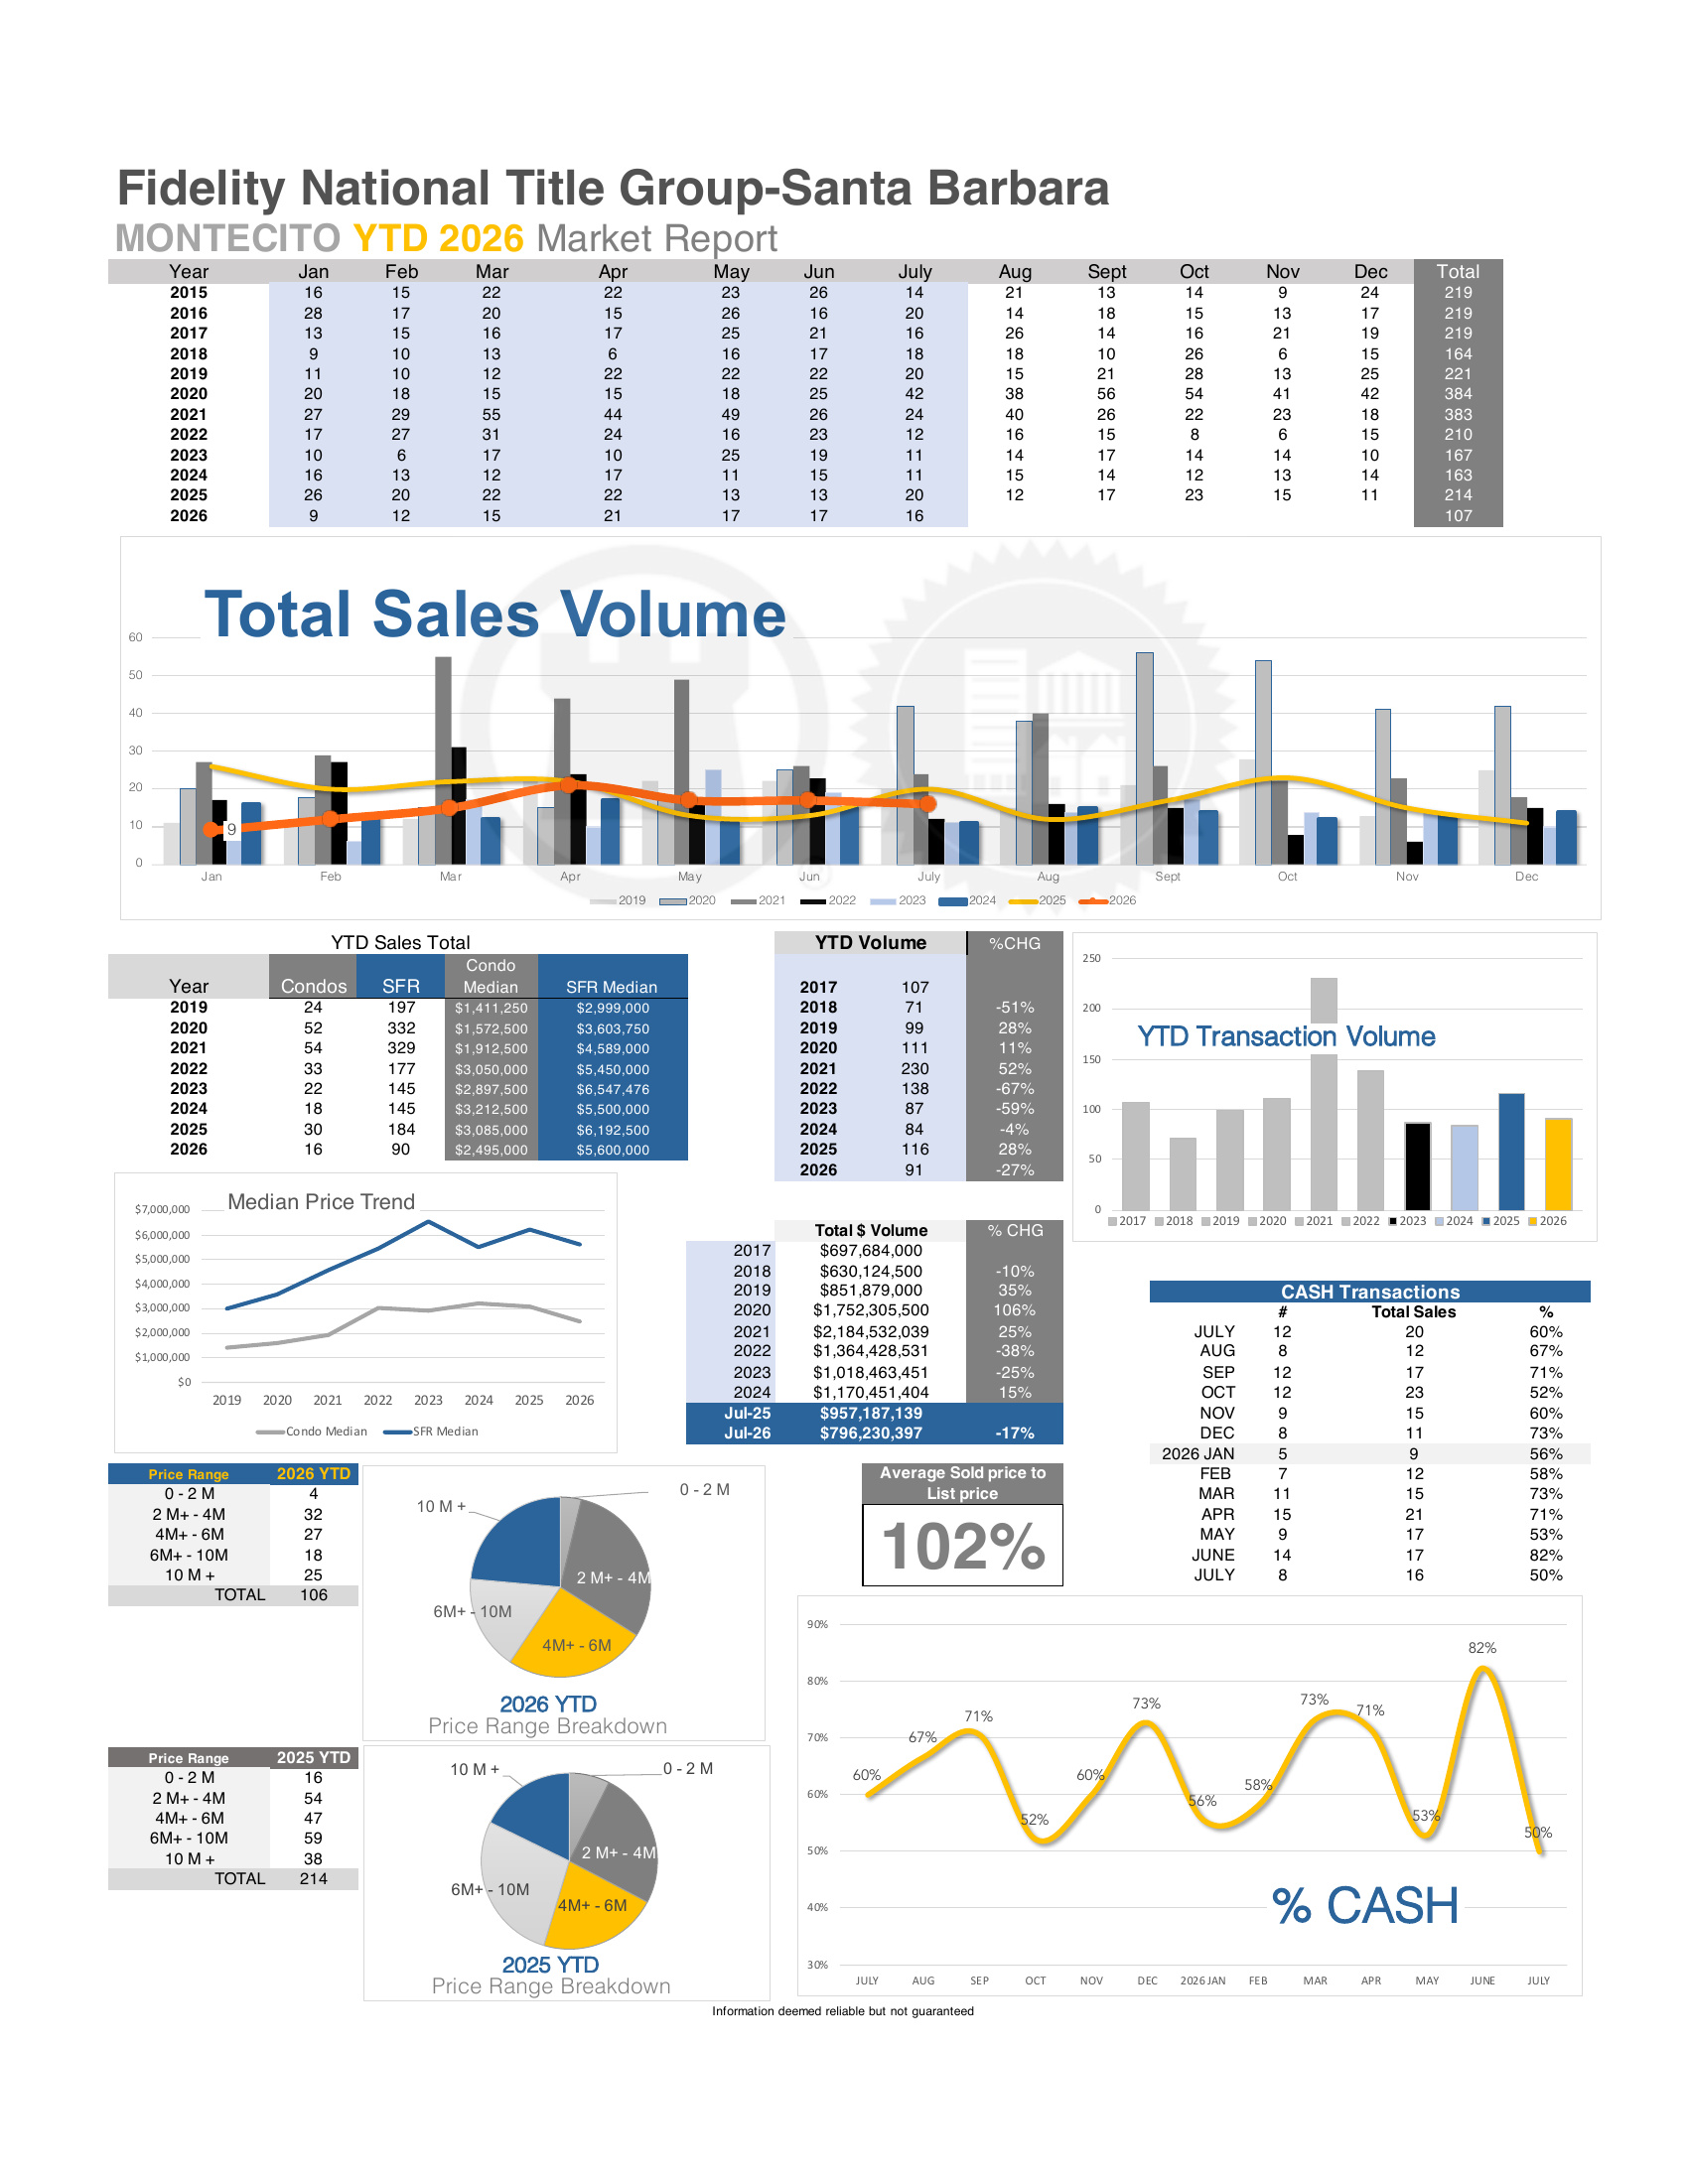
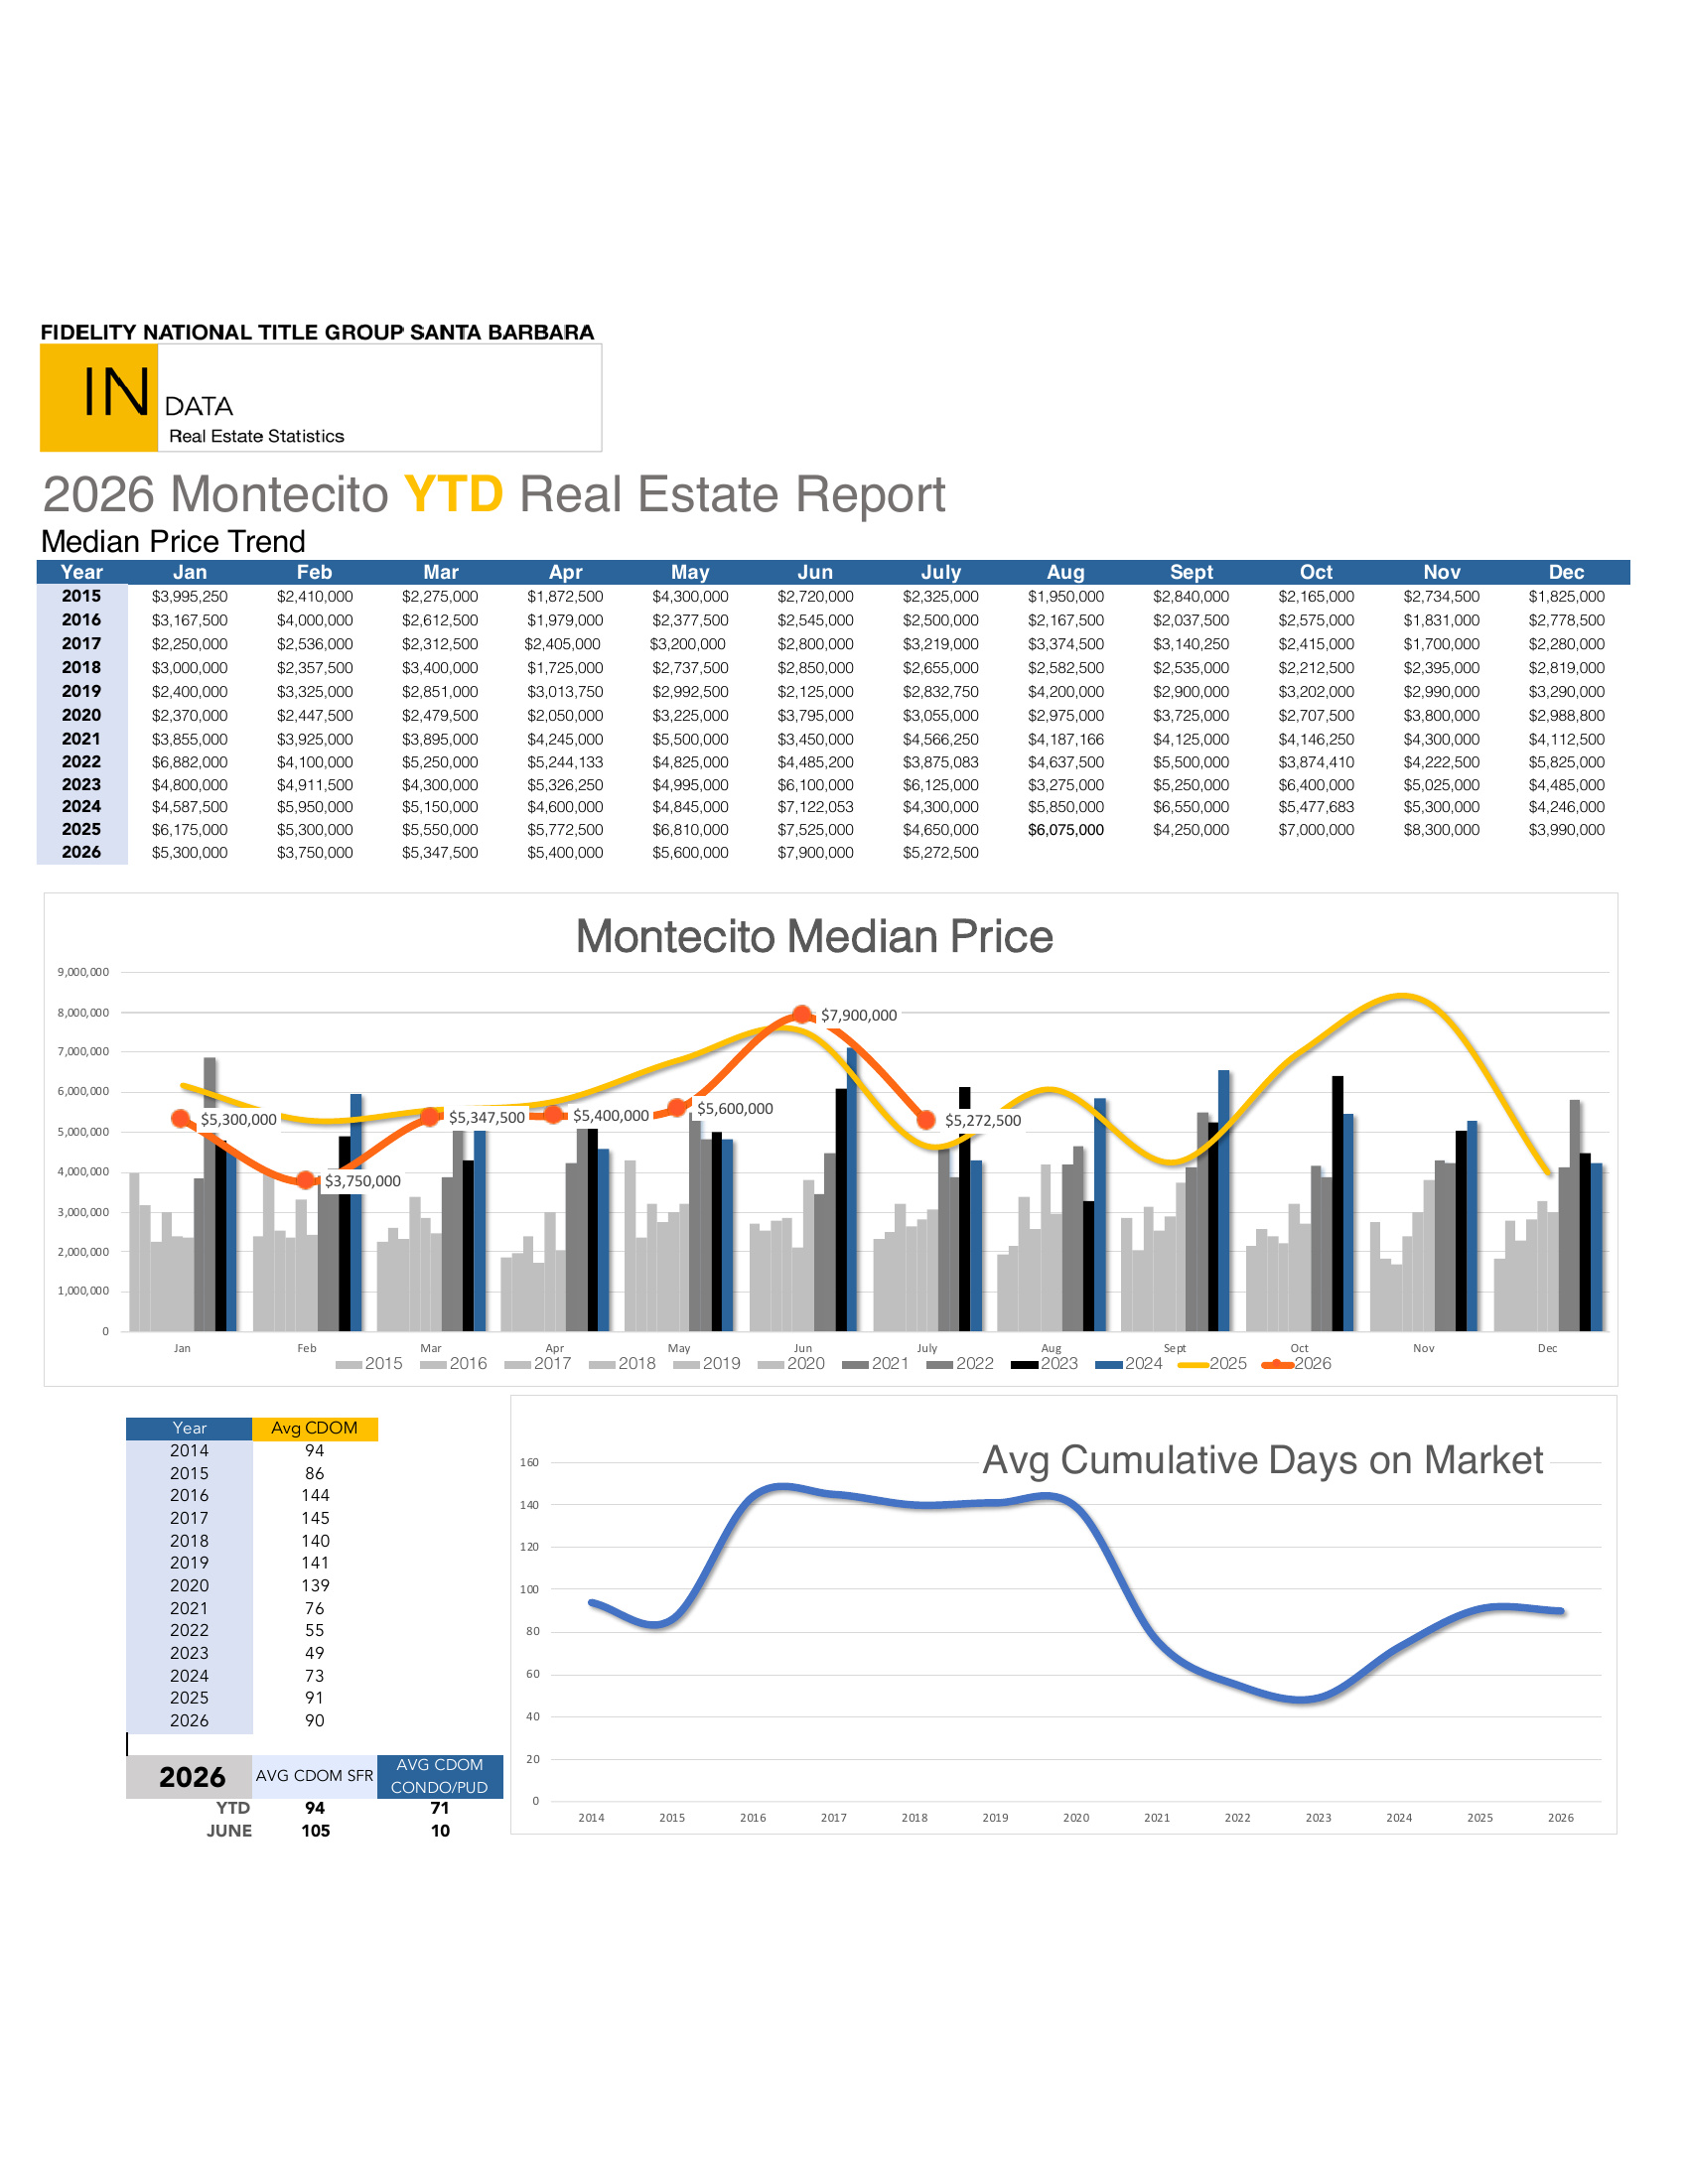
Montecito 2026 market report infographic with sales trends, price breakdowns, transaction totals, and cash-sale statistics.2026 Montecito real estate statistics report with median price and cumulative days on market charts. Montecito market statistics chart showing 14-year price trends, annual sales volume, and interest rates. Hope Ranch and Montecito single-family average and median price trends, with annual statistics from 2017 to year-to-date 2026.

Santa Ynez Valley Market Statistics

Santa Ynez Valley May 2026 housing statistics showing sales, prices, and 4.4 months of inventory.

Carpinteria Market Statistics

Carpinteria 2025 market report with sales trends, price statistics, and price-range charts.

Goleta Market Statistics

Goleta 2025 market report with sales-volume trends, median-price comparisons, and price-range charts.Goleta monthly median price trends, with a 2010–2025 data table and multiyear line chart.

Work With Nico

Nico takes pride in treating each transaction as if they were his own, navigating his clients with the highest standards of integrity, client advocacy, and an unwavering discretion required in high level transactions. Connect with him now!

Follow Me on Instagram